
STC
Indicateur
278 téléchargements
Version 1.0, Jan 2025
Windows, Mac
5.0
Avis : 2
Description
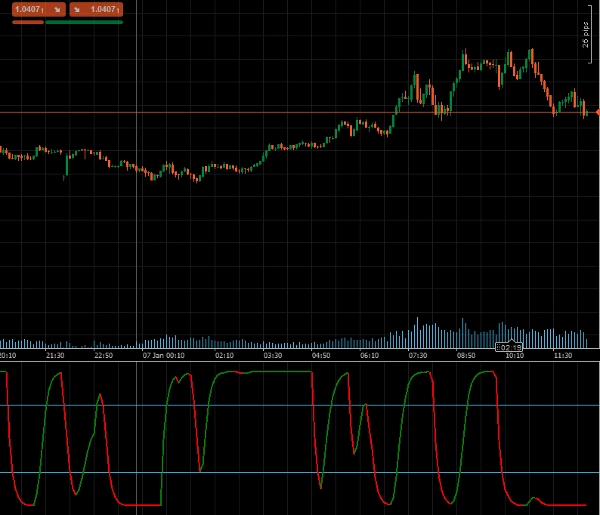
Le Schaff Trend Cycle (STC), développé par le célèbre analyste technique Doug Schaff, est un indicateur de trading avancé conçu pour identifier les tendances du marché et les retournements avec une rapidité et une précision exceptionnelles. Fondé sur l'idée innovante de combiner des composantes de tendance et de cycle, le STC utilise des moyennes mobiles exponentielles (EMA) et des calculs stochastiques pour surmonter les limites des indicateurs retardés comme le MACD ou l'oscillateur stochastique. Cette approche unique fournit des signaux de trading plus précoces et plus fiables, offrant un avantage significatif dans la détection des tendances et l'analyse du marché.
Caractéristiques principales :
- Détection précoce des tendances : Combine les moyennes mobiles exponentielles (EMA) avec des calculs stochastiques pour capter les tendances plus rapidement.
- Paramètres personnalisables : Ajustez la longueur, la MA rapide, la MA lente, le type de MA et le facteur de lissage pour adapter votre stratégie de trading.
- Alertes visuelles : Les changements dynamiques de couleur indiquent des tendances haussières ou baissières, facilitant l'interprétation des conditions du marché.
- Support des niveaux de surachat/survente : Les niveaux intégrés (25 et 75) aident à identifier les points de retournement potentiels du marché.
Paramètres
- Longueur : Définit le nombre de périodes pour le calcul de la tendance.
- Longueur MA rapide : Définit la longueur de la moyenne mobile rapide.
- Longueur MA lente : Spécifie la longueur de la moyenne mobile lente.
- Type de MA : Permet de sélectionner le type de moyenne mobile (par exemple, EMA, SMA).
- Facteur de lissage : Ajuste le facteur de lissage pour affiner les signaux de tendance.
Sorties
- STC : Fournit la valeur principale du Schaff Trend Cycle, représentant la direction et la force de la tendance, pour une utilisation programmatique dans les systèmes de trading automatisés.
- STCBull : Met en évidence les conditions de tendance haussière.
- STCBear : Met en évidence les conditions de tendance baissière.
Résumé
Profil de l'indicateur
Avis clients
5.0
Avis : 2
5 | 100 % | |
4 | 0 % | |
3 | 0 % | |
2 | 0 % | |
1 | 0 % |
Avis clients
August 12, 2025
Pros: Fast and accurate trend detection, earlier signals than MACD, customizable levels. Cons: No alerts, no MTF mode, no trade statistics.
Discussion
Questions fréquentes
MACD
Les produits disponibles sur cTrader Store, notamment les bots de trading, les indicateurs et les plug-ins, sont fournis par des développeurs tiers et mis à disposition à titre informatif et à des fins d'accès technique uniquement. cTrader Store n'est pas un courtier et ne fournit aucun conseil en investissement, aucune recommandation personnelle ni aucune garantie quant aux performances futures.
Plus de cet auteur


![Logo de "[Hamster-Coder] Pivot Points MTF"](https://cdn.ctrader.com/image/webp/4c143e5a-309c-40e3-a578-f04d1e133ffa_31159)

Prix
Depuis le 24/09/2024
4.44K
Installations gratuites