
Description
CE QUE CELA FAIT
Auto-Draw Fibonacci Suite détecte automatiquement les structures de swing et dessine simultanément sept outils géométriques—quatre outils Fibonacci plus trois outils d'analyse géométrique complémentaires—sans placement manuel requis.
L'analyse Fibonacci traditionnelle consiste à identifier les swings, dessiner les retracements, redessiner les éventails à partir des mêmes swings, placer manuellement les fourchettes, ajuster les zones temporelles. Chaque outil nécessite une configuration séparée. Chaque nouveau swing signifie tout redessiner.
Cet indicateur automatise l'ensemble de ce processus.
Les swings sont détectés une fois via la méthode de régression. Les sept outils géométriques — retracement, expansion, éventail et zones temporelles de Fibonacci, plus la fourchette d'Andrews, le canal équidistant et l'éventail de Gann — se réfèrent automatiquement aux mêmes points de swing.
Lorsque le prix crée un nouveau swing, chaque outil actif se met à jour en temps réel. Pas de redessin. Pas de sélection manuelle de swing. Pas d'incohérence géométrique due à l'utilisation de pivots différents entre les outils.
LE BÉNÉFICE PRINCIPAL
Approche manuelle :
- Identifier visuellement le plus haut et le plus bas du swing
- Tracer le retracement de Fibonacci
- Identifier à nouveau les mêmes swings, tracer l’éventail
- Trouver trois swings, placer manuellement la fourchette
- Le prix crée un nouveau swing → répéter tout le processus
Approche Auto-Draw :
- L’indicateur détecte automatiquement les swings
- Les sept outils se dessinent et se mettent à jour eux-mêmes
- Le prix crée un nouveau swing → tout se met à jour automatiquement
- La différence est structurelle. Au lieu de sept flux de travail manuels séparés, vous avez un système de détection automatisé projetant sur tous les domaines géométriques — outils basés sur Fibonacci pour l’analyse des ratios et trois cadres géométriques supplémentaires pour une cartographie complète de la structure du marché.
LA SUITE D’OUTILS
Quatre outils Fibonacci :
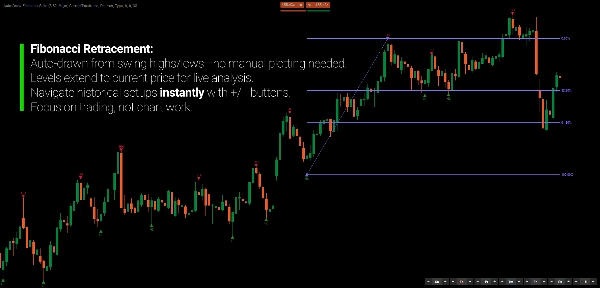
- Retracement de Fibonacci — niveaux horizontaux (0%, 38,2%, 61,8%, 100%)
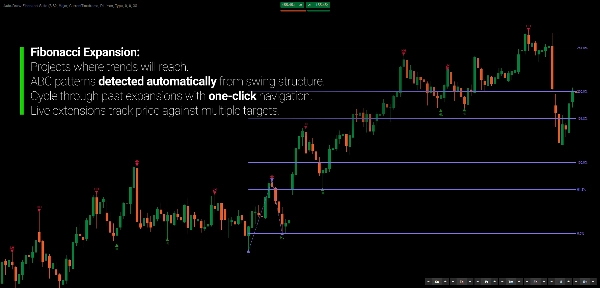
- Expansion de Fibonacci — cibles de projection au-delà du troisième swing
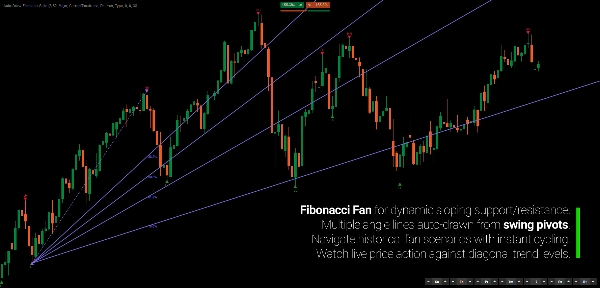
- Éventail de Fibonacci — lignes de tendance diagonales à partir des points pivots
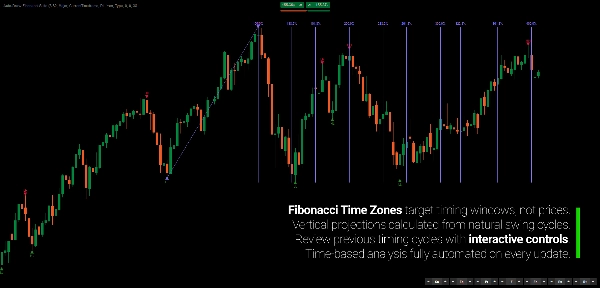
- Zones temporelles de Fibonacci — projection temporelle verticale
Trois outils géométriques complémentaires :
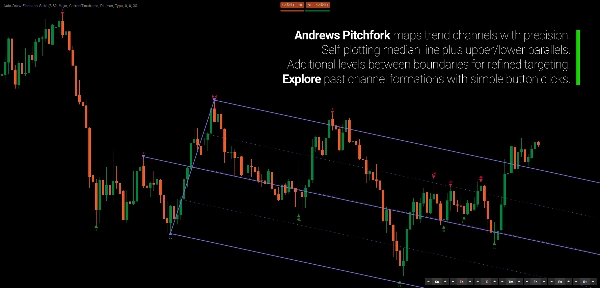
- Fourchette d’Andrews — médiane à trois points avec canaux parallèles
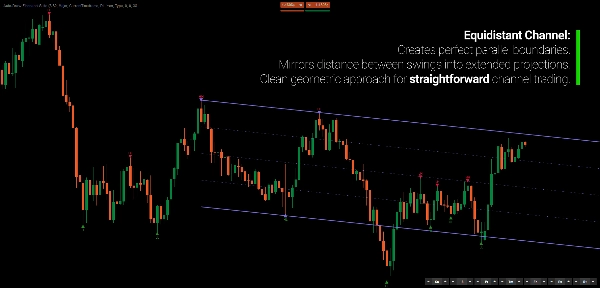
- Canal équidistant — canal parallèle avec niveaux intermédiaires
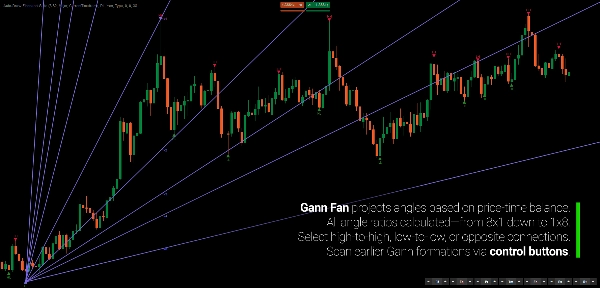
- Éventail de Gann — projections d’angles prix-temps (8x1, 4x1, 2x1, 1x1, 1x2…)
Chaque outil peut être activé indépendamment. Tous se réfèrent à la même détection de swing sous-jacente.
DÉTECTION UNIFIÉE DES SWINGS
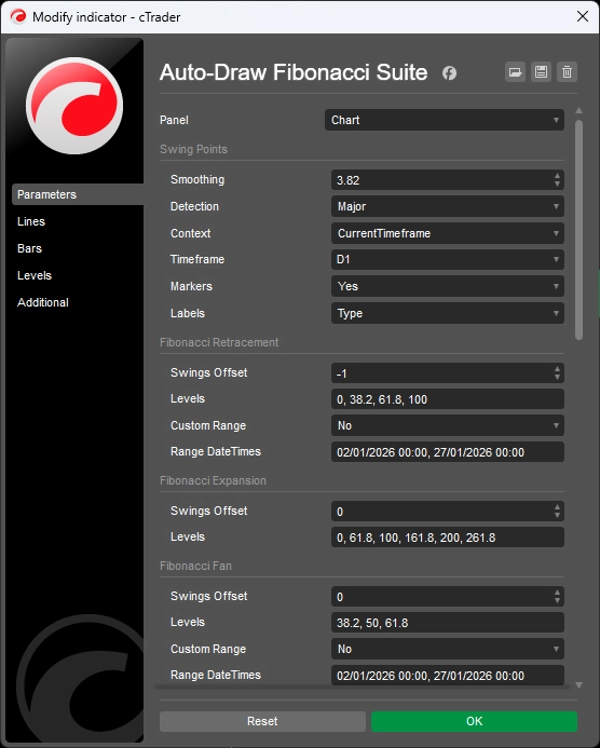
Trois modes de détection contrôlent la sensibilité des swings :
- Majeur — moins de swings, mais plus forts (confirmés par les clôtures)
- Standard — granularité équilibrée (le plus courant)
- Mineur — détecte les swings internes dans les tendances (détail maximal)
Les swings sont automatiquement classifiés (HH/LL/LH/HL) et mesurés par profondeur, volume et durée. Des marqueurs visuels montrent les swings confirmés (triangles), non confirmés (cercles) et internes (carrés).
COMMANDES DÉCALAGE INTERACTIVES
Sept groupes de boutons (un par outil) vous permettent d’ajuster instantanément quels swings historiques chaque projection géométrique utilise :
- 0 — structure de swing la plus récente
- -1 — structure précédente
- -2 — deux structures en arrière
Reculez dans l’historique des swings pour voir comment les relations géométriques ont évolué aux points structurels précédents. Changez les swings de référence de n’importe quel outil sans affecter les autres.
PRISE EN CHARGE MULTI-TIMEFRAME
Appliquez la détection de swing à une unité de temps supérieure tout en visualisant un graphique d’unité de temps inférieure. Voyez les swings journaliers et toutes les projections géométriques sur votre graphique H1 — sans changer d’unité de temps.
CARACTÉRISTIQUES CLÉS
- Détection automatique des swings via méthodologie de régression
- Sept outils géométriques dessinés automatiquement à partir de références de swings unifiées
- Mises à jour en temps réel lors de la formation de nouveaux swings
- Commandes interactives de décalage pour chaque outil
- Mode multi-timeframe (analyser le journalier, trader en H1)
- Trois modes de détection (Majeur/Standard/Mineur)
- Classification des swings (HH/LL/LH/HL) et métriques
- Regroupement intelligent des swings (élimine les swings intermédiaires redondants)
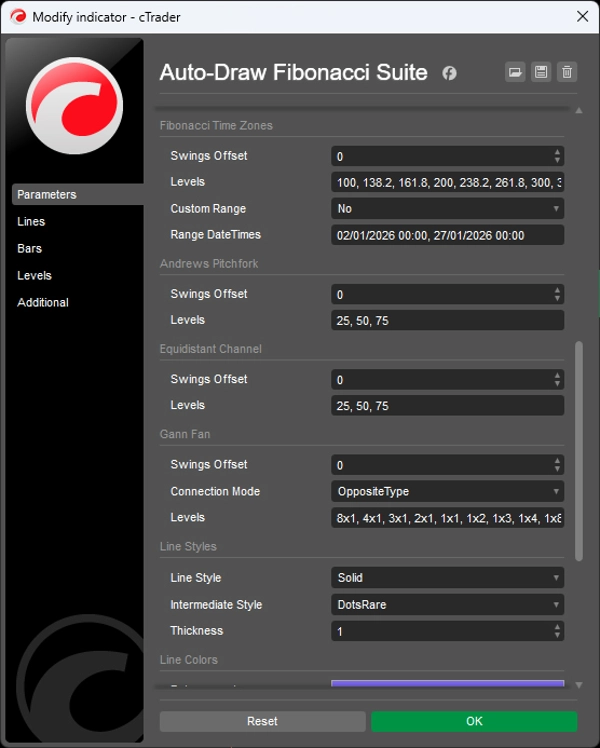
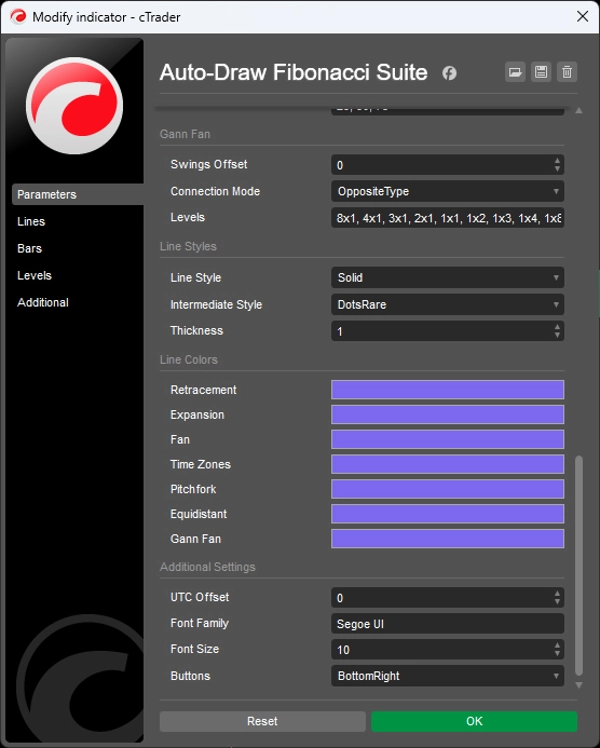
- Niveaux, couleurs, styles entièrement personnalisables
- Swings sources mis en évidence pour les outils actifs
POUR QUI C’EST
Cet indicateur s’adresse aux traders qui comprennent les outils d’analyse Fibonacci et géométrique mais ne veulent pas passer de temps à les placer et redessiner manuellement.
Si vous utilisez plusieurs projections Fibonacci et redessinez constamment au fur et à mesure que le prix évolue — ou évitez certains outils parce que leur placement manuel est trop fastidieux — cette suite automatise ce flux de travail.
Elle convient bien aux traders de swing et de position qui ont besoin d’une référence géométrique sur plusieurs outils, aux analystes multi-timeframe qui veulent la structure d’une unité de temps supérieure sur les graphiques d’exécution, et aux traders discrétionnaires qui valorisent la confluence géométrique mais pas la charge de gestion manuelle des outils.
Ce n’est pas un système de signal. C’est un outil d’automatisation pour les traders qui pensent déjà en termes de Fibonacci et de géométrie et veulent que leur analyse se mette à jour automatiquement.
CE QUI LE REND DIFFÉRENT
La plupart des indicateurs d’analyse géométrique dessinent un seul type d’outil. Cette suite en dessine sept simultanément à partir d’une détection unifiée des swings.
La plupart nécessitent une sélection manuelle des swings. Ceci automatise l’identification des swings et met à jour tous les outils en temps réel.
La plupart traitent chaque outil indépendamment. Ceci maintient la cohérence géométrique en assurant que toutes les projections se réfèrent aux mêmes structures sous-jacentes.
Le résultat : une analyse géométrique multi-cadres complète sans redessin constant.
---
COMPRENDRE FIBONACCI COMME LANGAGE GÉOMÉTRIQUE
L’analyse Fibonacci est souvent mal comprise comme prédictive — comme si les marchés « respectaient » certains ratios. Cela manque le principe fondamental.
Les ratios Fibonacci ne prédisent pas où le prix ira. Ils fournissent un vocabulaire géométrique standardisé pour décrire comment le prix évolue par rapport à la structure antérieure. Un retracement à 61,8 % représente une relation géométrique entre la correction actuelle et l’impulsion précédente — pas un « support » au sens causal.
La valeur réside dans la cohérence géométrique, pas dans les niveaux individuels. Lorsque plusieurs projections convergent — niveau de retracement aligné avec l’angle de l’éventail et la zone temporelle — cette convergence reflète une cohérence structurelle à travers différents domaines de mesure.
Les marchés ne ciblent pas les niveaux Fibonacci. Lorsque les projections géométriques s’alignent, cet alignement révèle un ordre structurel sous-jacent. C’est pourquoi les niveaux isolés ont une valeur limitée tandis que les structures géométriques convergentes marquent souvent des points d’inflexion.
La géométrie n’est pas la cause. C’est le langage descriptif des relations structurelles.
---
Le trading comporte des risques. Cet indicateur est un outil d’analyse technique — appliquez toujours une gestion appropriée des risques.


![Logo de "[Hamster-Coder] Bollinger Bands"](https://cdn.ctrader.com/image/webp/21d8e5d6-fb11-4bac-b9ee-cd05c2b76804_30327)
