EKVWAP
지표
2.57K 다운로드
버전 1.0, Jan 2025
Windows, Mac
4.3
리뷰: 6
설명
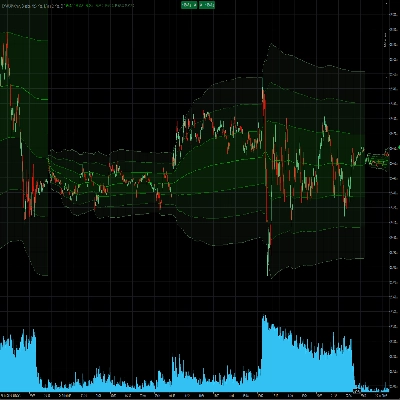
이것은 모든 측면을 사용자 정의할 수 있는 고급 VWAP 지표입니다.
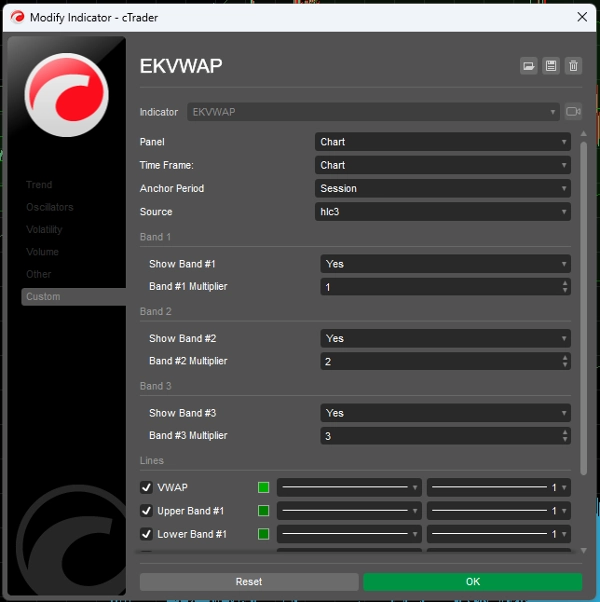
VWAP를 다음에 고정할 수 있습니다:
- 수동 고정 지점에.
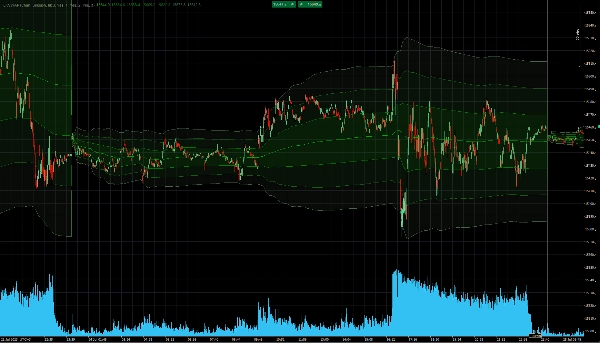
- 하루에 여러 세션이 있는 시장의 경우 세션별로 (예: HK50 또는 AUS200),
- 일별로
- 주별로
최대 3개의 표준 편차 밴드 표시를 지원합니다. 각 밴드에 사용자 지정 색상을 설정할 수 있으며, 배수도 설정하거나 단순히 숨기거나 표시할 수 있습니다.
수동 고정 지점:
그래프에서 막대를 클릭한 후, Alt-A 키(옵션에서 구성 가능)를 눌러 VWAP 계산을 위한 수동 고정 지점을 설정합니다. 계산은 Alt-A 키를 누를 때 위치한 지점부터 시작됩니다. 다시 Alt-A를 누르면 수동 VWAP 계산이 종료되고 이전 계산으로 돌아갑니다.
요약
AI 요약
EKVWAP is an advanced Volume Weighted Average Price (VWAP) indicator designed for customizable technical analysis. It allows users to anchor the VWAP calculation to various points, including a manual anchor set directly on the chart, by trading session (useful for markets with multiple daily sessions such as HK50 or AUS200), by day, or by week. The indicator supports the display of up to three standard deviation bands, each with configurable multipliers and colors, which can be shown or hidden according to user preference. Manual anchoring is enabled by selecting a bar on the chart and activating the anchor point via a configurable keyboard shortcut, allowing the VWAP calculation to start from that specific point. This flexibility facilitates detailed volume-based price analysis across different timeframes and market sessions.
지표 프로필
고객 리뷰
4.3
리뷰: 6
5 | 50 % | |
4 | 33 % | |
3 | 17 % | |
2 | 0 % | |
1 | 0 % |
고객 리뷰
August 21, 2025
Nice indicator. My major issue with it is that it automatically fills the bands with the colour selected for the lines. There is no facility to deselect this. Please add the capability to deselect band fill as it can be obtrusive, especially if using colours for another indicator on the chart.
July 9, 2025
Pros: Flexible anchored VWAP with customizable start point. Visual cloud of deviations. Easy integration and stable performance. Cons: No alerts on key levels. No statistics on VWAP re-tests. Lacks tooltip information and quick template saving.
June 18, 2025
June 5, 2025
Really good. all i think is left, is making one on UCT 0. Can you do That? I need to use this indicator to be a reference to a cBot, but i cant do that because the system dont have access to the code. Can you sell one to be used by cBot ¡please!.
상담
자주 묻는 질문(FAQ)
VWAP
트레이딩 봇, 지표, 플러그인 등 cTrader Store에서 제공되는 상품은 제3자 개발자에 의해 제공되며, 이는 단순히 정보 및 기술적 접근을 목적으로 제공된 것입니다. cTrader Store는 중개인이 아니며, 투자 조언, 개인별 추천 또는 향후 성과에 대한 어떠한 보장도 제공하지 않습니다.
좋아하실 만한 다른 항목


가격
가입일 27/11/2024
14.22M
거래량
8.76K
핍 수익
2.57K
무료 설치