Description
Bar Force est un indicateur d'analyse de la force des barres conçu pour aider les traders à identifier rapidement les moments d'expansion de la volatilité et l'élan du marché.
L'indicateur classe automatiquement chaque barre en fonction de sa force relative par rapport aux barres précédentes, affichant une valeur numérique directement sur le graphique. Cela facilite la détection des chandeliers faibles, moyens ou extrêmement forts dans le contexte récent du marché.
La Version Complète offre un contrôle total sur les paramètres d'analyse, permettant aux traders d'adapter l'indicateur à différents marchés, intervalles de temps et styles de trading.
Caractéristiques clés
✔ Classification automatique de la force des barres
✔ Basé sur la volatilité récente du marché
✔ Affichage direct sur le graphique pour une analyse visuelle rapide
✔ Idéal pour le Price Action, le Breakout et le trading de Momentum
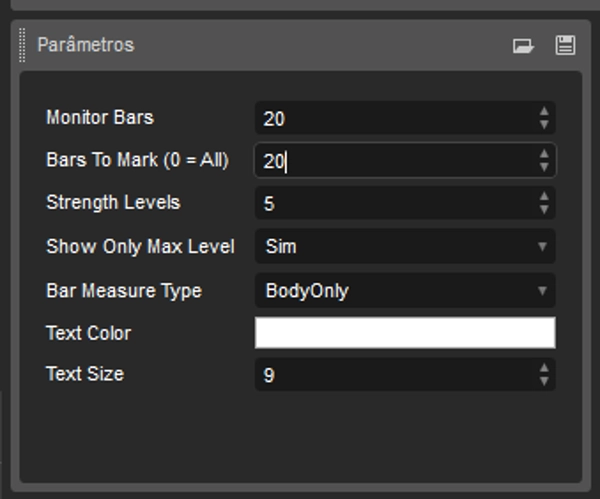
Paramètres configurables
La version complète offre une personnalisation complète.
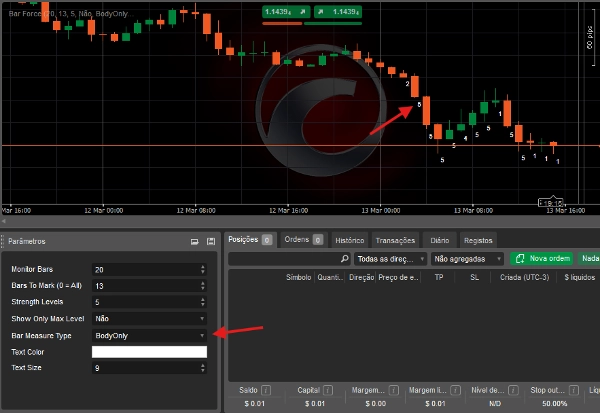
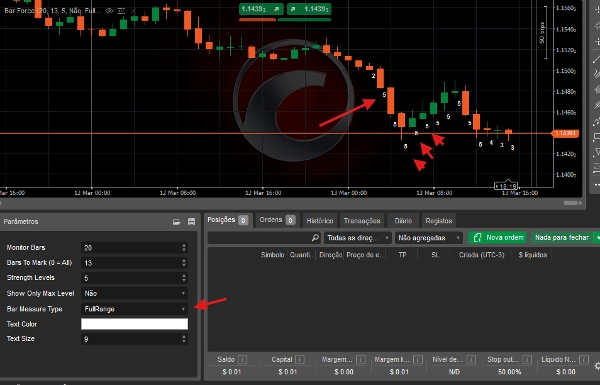
Type de mesure des barres
Les utilisateurs peuvent choisir comment la force de chaque barre est calculée :
- Plage complète – utilise la plage totale de la bougie (Haut – Bas)
- Corps uniquement – utilise uniquement le corps de la bougie (Ouverture – Fermeture)
Cela permet à l'indicateur d'être utilisé à la fois pour l'analyse de la volatilité et l'analyse de la force directionnelle.
Plage de surveillance
Définit combien de barres précédentes sont utilisées pour calculer la force moyenne du marché.
Exemples :
- 50 barres
- 100 barres
- 200 barres
Cela permet à l'indicateur de s'adapter à différentes conditions de marché.
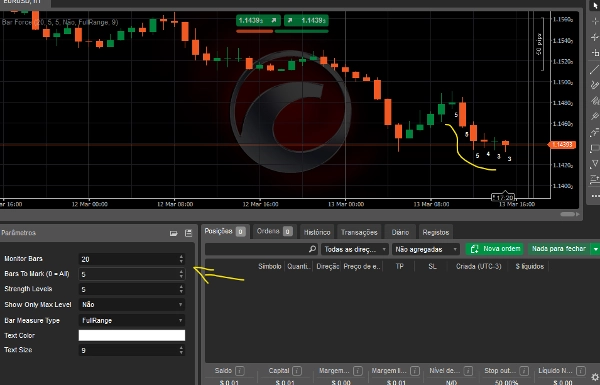
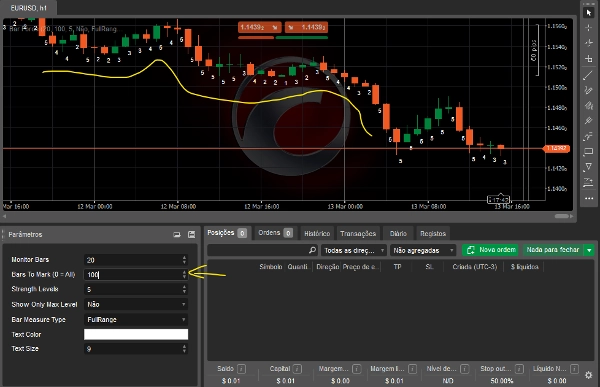
Nombre de barres affichées
Les traders peuvent choisir combien de barres récentes afficheront la classification de la force sur le graphique.
Exemples :
- les 5 dernières barres
- les 20 dernières barres
- ou l'historique complet
Échelle de force
Définit combien de niveaux de classification sont utilisés.
Exemples :
- échelle de 1 à 3
- échelle de 1 à 5
- ou une plage personnalisée
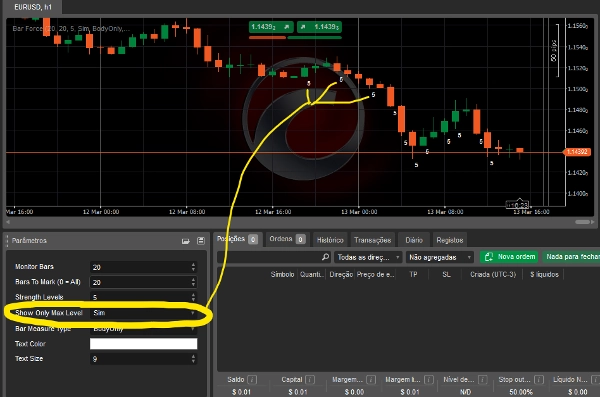
Filtre de niveau maximum
Option pour afficher uniquement les barres atteignant le niveau de force maximal, facilitant l'identification des événements de fort momentum.
Personnalisation visuelle
Les utilisateurs peuvent également ajuster :
- la couleur du texte
- la taille du texte
permettant à l'indicateur de s'adapter à la mise en page de leur graphique.
À qui s'adresse cet indicateur ?
- Traders Price Action
- Traders Breakout
- Traders cherchant à identifier l'expansion du momentum et de la volatilité
Bar Force transforme l'analyse visuelle des chandeliers en une classification objective de la force, aidant les traders à identifier rapidement les opportunités potentielles sur le marché.
Résumé
Avis clients
5 | 67 % | |
4 | 33 % | |
3 | 0 % | |
2 | 0 % | |
1 | 0 % |