Description
DÉTECTEUR DE SWING
Points de Swing Structurels + Retracement de Fibonacci + RSI
--------------------------------------------------
INDICATEUR GRATUIT
Identifiez les swings structurels. Voyez la tendance. Tradez avec confluence.
--------------------------------------------------
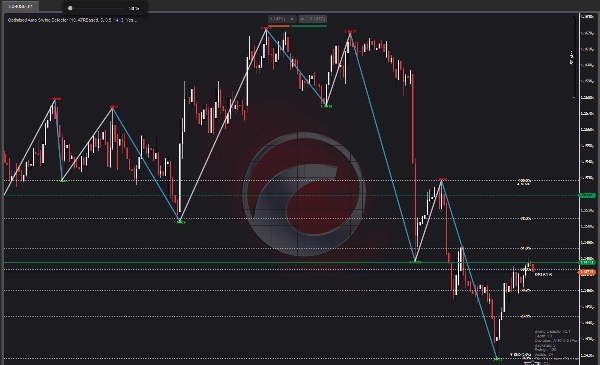
CE QUE CET INDICATEUR FAIT
Swing Detector identifie les hauts et bas structurels des swings en utilisant la détection d'extrema locaux avec une profondeur configurable et un filtrage automatique par déviation.
Il connecte ensuite les swings avec des lignes de tendance, superpose les niveaux standards de retracement de Fibonacci, et affiche la valeur actuelle du RSI près du prix.
--------------------------------------------------
CARACTÉRISTIQUES CLÉS
- Détection des points de swing (profondeur configurable)
- DÉVIATION AUTOMATIQUE : Filtrage basé sur l'ATR qui s'adapte à n'importe quelle unité de temps
- Mode de déviation fixe en pips (pour contrôle manuel)
- Lignes de tendance des swings (montée en bleu, descente en orange)
- RETRACEMENT DE FIBONACCI (0, 23,6, 38,2, 50, 61,8, 78,6, 100 pour cent)
- SUPERPOSITION DE LA VALEUR RSI (RSI actuel près du prix)
- Couleurs personnalisables
- Optimisé pour la performance (nombre maximal de barres à dessiner)
--------------------------------------------------
DÉVIATION AUTOMATIQUE - CARACTÉRISTIQUE CLÉ
Deux modes de déviation disponibles :
- PIPS FIXES : Définissez une distance minimale en pips fixe entre les swings
- BASÉ SUR L'ATR (AUTO) : Déviation dynamique basée sur la volatilité actuelle
POURQUOI LA DÉVIATION AUTOMATIQUE EST IMPORTANTE :
- M1 à M5 : Déviation serrée (capture les petits swings)
- H1 à H4 : Déviation moyenne (capture la structure)
- D1 à MN1 : Déviation large (capture les swings majeurs)
L'indicateur s'adapte automatiquement à l'unité de temps que vous utilisez. Aucun ajustement manuel nécessaire lors du changement de graphique.
Cela rend Swing Detector utilisable sur TOUTES les unités de temps — des graphiques d'une minute aux graphiques mensuels.
--------------------------------------------------
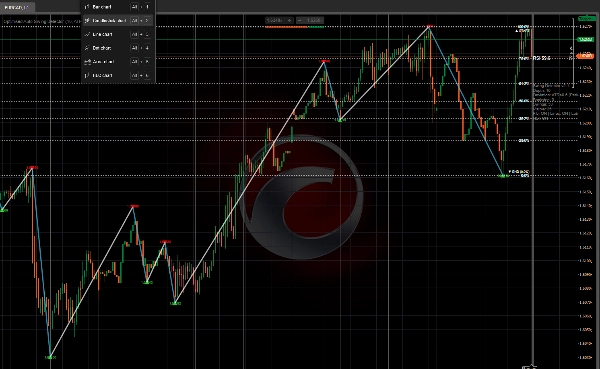
RETRACEMENT DE FIBONACCI - CARACTÉRISTIQUE CLÉ
Pour le dernier swing terminé, l'indicateur dessine :
- 0,0 pour cent (début du swing)
- 23,6 pour cent
- 38,2 pour cent
- 50,0 pour cent
- 61,8 pour cent
- 78,6 pour cent
- 100,0 pour cent (fin du swing)
Activez ou désactivez les lignes et les étiquettes. Tous les niveaux sont codés par couleur pour une référence visuelle rapide.
--------------------------------------------------
SUPERPOSITION RSI - CARACTÉRISTIQUE CLÉ
La valeur actuelle du RSI est affichée près du prix avec un codage couleur :
- ROUGE : RSI au-dessus de 70 (surachat)
- VERT : RSI en dessous de 30 (survente)
- BLANC : RSI entre 30 et 70 (neutre)
Cela fournit un contexte immédiat de momentum sans ouvrir une fenêtre RSI séparée.
--------------------------------------------------
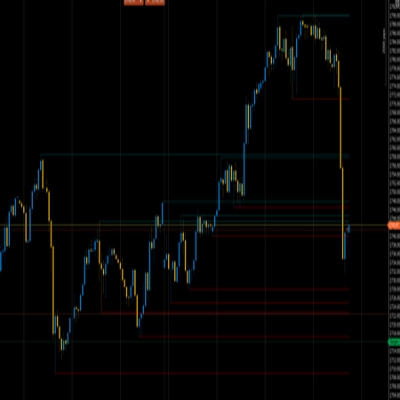
ÉLÉMENTS VISUELS
- Flèches rouges vers le bas = Hauts de swing
- Flèches vertes vers le haut = Bas de swing
- Lignes bleues = Montée (du bas vers le haut)
- Lignes orange = Descente (du haut vers le bas)
- Lignes horizontales dorées = Niveaux de Fibonacci
- Étiquettes blanches = Pourcentages de Fibonacci
- Valeur RSI = RSI actuel près du prix
- Panneau d'information = Profondeur, déviation, recul, nombre de swings
--------------------------------------------------
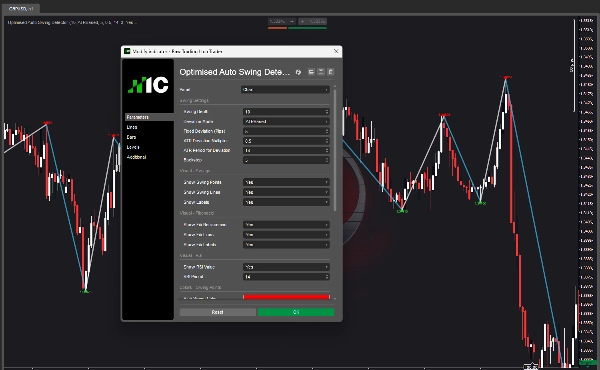
APERÇU DES PARAMÈTRES
PARAMÈTRES DE SWING :
- Profondeur du Swing : Nombre de barres à vérifier pour les extrema locaux
- Mode de déviation : Pips fixes ou basé sur l'ATR (Auto)
- Déviation fixe : Distance minimale en pips entre les swings
- Multiplicateur de déviation ATR : Multiplicateur pour la déviation basée sur l'ATR
- Période ATR : Période pour le calcul de l'ATR
- Recul : Nombre minimal de barres entre les swings
VISUEL - SWINGS :
- Afficher les points de swing : Activer/désactiver les flèches
- Afficher les lignes de swing : Activer/désactiver les lignes de tendance
- Afficher les étiquettes : Activer/désactiver les étiquettes de prix
VISUEL - FIBONACCI :
- Afficher le retracement Fib : Activer/désactiver la superposition Fibonacci
- Afficher les lignes Fib : Activer/désactiver les lignes horizontales
- Afficher les étiquettes Fib : Activer/désactiver les étiquettes de pourcentage
VISUEL - RSI :
- Afficher la valeur RSI : Activer/désactiver la superposition RSI
- Période RSI : Période pour le calcul du RSI
COULEURS :
- Couleur du Swing Haut
- Couleur du Swing Bas
- Couleur de la ligne de montée
- Couleur de la ligne de descente
- Couleur de la ligne Fib
- Couleur du texte Fib
- Couleur de l'étiquette RSI
PERFORMANCE :
- Nombre maximal de barres à dessiner : Limite le dessin pour une performance plus rapide
--------------------------------------------------
CAS D'UTILISATION
- Identifier les points de swing structurels sur N'IMPORTE QUELLE unité de temps
- Tracer des lignes de tendance entre les swings
- Utiliser les niveaux de Fibonacci pour les entrées, sorties et objectifs de profit
- Confirmer les trades avec la confluence du RSI
- Comprendre la structure du marché en un coup d'œil
- Changer d'unité de temps sans ajuster les paramètres (Déviation automatique)
--------------------------------------------------
UTILISABILITÉ PAR UNITÉ DE TEMPS
Avec la DÉVIATION AUTOMATIQUE activée, l'indicateur fonctionne sur :
- M1, M5, M15 (scalping)
- M30, H1, H4 (day trading)
- D1 (swing trading)
- W1, MN1 (position trading)
Un indicateur. Toutes les unités de temps.
--------------------------------------------------
MISE À NIVEAU VERS STRUCTURAL HEAT ZONES
Cet indicateur gratuit vous montre les swings et la structure.
Structural Heat Zones va plus loin — il cartographie l'intensité de participation, l'acceptation vs le rejet, et l'engagement du marché à travers plusieurs zones.
Recherchez Structural Heat Zones dans la boutique cTrader.
--------------------------------------------------
MISE À NIVEAU VERS INVICTUS EA
Invictus EA utilise la même technologie structurelle pour exécuter des trades automatisés.
Recherchez Invictus dans la boutique cTrader.
--------------------------------------------------
NOTES TECHNIQUES
- Indicateur en superposition
- Fonctionne sur n'importe quelle unité de temps et symbole
- Pas de repaint (les swings sont historiques)
- Optimisé pour la performance
--------------------------------------------------
SUPPORT
Mises à jour à vie incluses.
POUR PLUS D'INFORMATIONS - Cliquez sur le profil du développeur ci-dessous.
Résumé
Avis clients
5 | 100 % | |
4 | 0 % | |
3 | 0 % | |
2 | 0 % | |
1 | 0 % |


![Logo de "Gaussian Channel [Iridio Capital]"](https://cdn.ctrader.com/image/webp/7c039209-5573-4a54-a072-f9528b503103_41960)