
Description
🚀 Plus de 10 000 traders utilisent déjà nos MEILLEURS indicateurs🏆
Découvrez pourquoi les professionnels nous choisissent – les outils les plus puissants sur cTrader (indicateurs, algorithmes et cBots) vous attendent.
👉 Obtenez tous nos MEILLEURS systèmes ici :
_______________________________________________
📌 Indicateurs de Structure de Marché
· ✅ AdvancedMarket Structure : Bos, Choch, SwinLevels, Order Blocks, Market Structure& Liquidity Finder
· 🔄 Analyse Dynamique de la Structure du Marché des Points de Renversement
· 🧱 Order Block
· ⛓️ BOS & CHOCH
· 🧠 ICT Power of 3
· 🌀 Zones de Polarité du Marché
_______________________________________________
🔚 Systèmes de Sortie Intelligents
· 📍 Algorithme Intelligent de Trailing
_______________________________________________
📐 Indicateurs ZigZag
· 🔍 Projection de Liquidité des Prix ZigZag
· ➖ ZigZag
· 🎯 Suivi des Extrêmes Zig-Zag
_______________________________________________
🧱 Indicateurs de Support & Résistance
· 🟩 Lignes de Support & Résistance SmartTrend
· 🧱 Tous les Niveaux de Support et Résistance
_______________________________________________
📊 Indicateurs de Tendance & Canal
· 🔄 Canal de Tendance Automatique
· 📊 Supertrend
· ⚡Analyseur de Tendance Momentum
· 🧠 Canal de Tendance Adaptatif
· 💥 Système de Rupture de Canal
· 🌈 Gradient de Tendance Dynamique
_______________________________________________
💧 Outils de Volume & Liquidité
· 🔥 Carte Thermique du Volume POC
· 📉 Carte de Liquidation à Effet de Levier
· 🔍 Écart de Valeur Juste Momentum
· 🕒 Sessions d'Écart de Valeur Juste
_______________________________________________
⚡ Indicateurs Momentum & RSI
· 📈 Déclencheur de Tendance RSI
· 🚀 Momentum de Plage Dynamique
· 🔎 Biais de Chandelle Multi-Niveaux
Suivi
_______________________________________________
🔮 Outils de Prédiction & Projection
· 📐 Prédiction Basée sur Linreg & ATR
· 📏 Régression Linéaire Fibonacci Multi-échelles
· 📈 Projecteur de Flux de Marché Alimenté par le Volume
______________________________________________________________________________________________
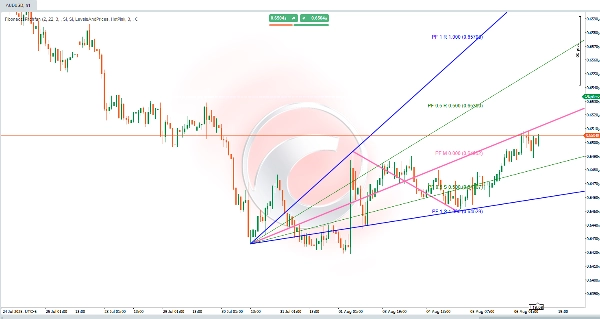
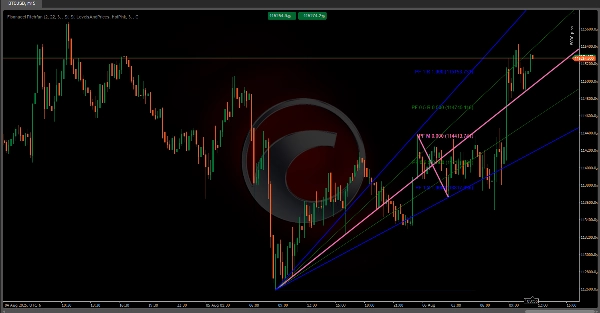
Fibonacci Pitchfan 📊✨
Un indicateur technique avancé qui combine la détection de pivots, des lignes de tendance dynamiques, et des niveaux de Fibonacci pour créer un outil visuel aider les traders à identifier les tendances, les zones de support/résistance et les points de retournement potentiels. 🎯 Hautement personnalisable, il s’adapte à différents styles de trading via des paramètres configurables. Voici une explication de sa logique et de ses calculs.
Composants Principaux 🔧
L’indicateur repose sur trois éléments clés fonctionnant ensemble :
1. Détection de Pivot 🔄
- Identifie les points clés de renversement de prix (pivots hauts/bas).
- Utilise une plage de barres définie par l’utilisateur (profondeur du pivot) pour déterminer si une barre est un haut/bas significatif par rapport aux barres environnantes.
- Filtre le bruit en exigeant que les pivots dépassent un seuil de déviation basé sur l’ATR, garantissant que seuls les mouvements de prix pertinents soient pris en compte.
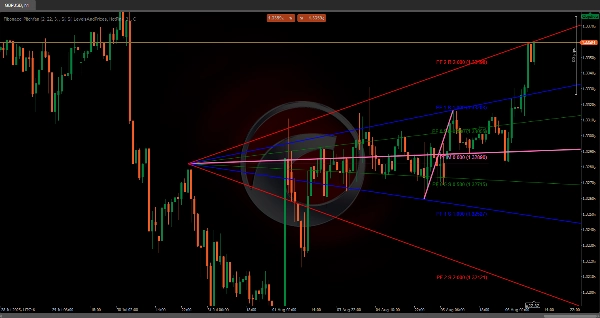
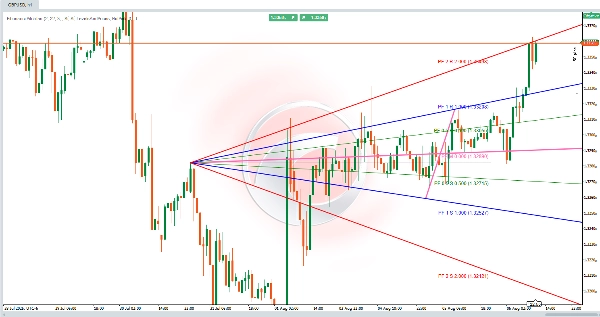
2. TrendFan & Niveaux de Fibonacci 📐
- Projette un éventail de lignes de tendance dynamiques à partir d’un pivot historique vers le futur, en utilisant des niveaux prédéfinis (ex. : 0,25, 0,5, 1,0) pour marquer des zones potentielles de support/résistance.
- Les niveaux de Fibonacci optionnels (lignes horizontales) mettent en évidence les retracements/extensions entre pivots clés.
Logique de Calcul 🧮
1. Identification des Pivots
- Pour chaque barre, l’algorithme analyse une plage symétrique de barres précédentes/suivantes (basée sur la profondeur du pivot).
- Un pivot haut est confirmé si le plus haut de la barre est le plus élevé de la plage ; un pivot bas si son plus bas est le plus bas.
- Le seuil de déviation (un % de l’ATR par rapport au prix) filtre les fluctuations mineures, se concentrant sur les mouvements significatifs du marché.
2. Génération du TrendFan 🌪️
- Un pivot historique de référence (configurable) est associé au dernier pivot pour former une base.
- Une ligne médiane est tracée entre eux, et des lignes de tendance projetées (à des niveaux prédéfinis) s’étendent dans le futur, créant un "éventail" de zones clés de prix.
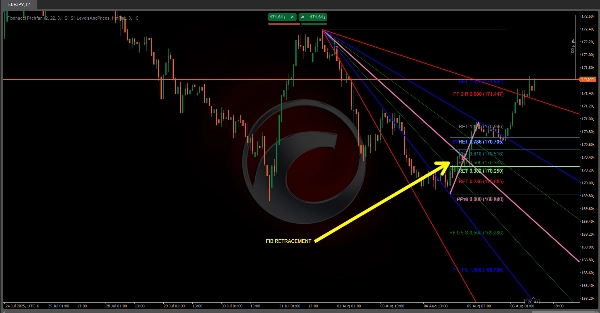
3. Projections Fibonacci 🔢
- Niveaux de retracement (ex. : 0,236, 0,5, 0,618) marquent des zones potentielles de repli dans le mouvement de prix précédent.
- Niveaux d’extension projettent des objectifs de prix au-delà de la plage initiale, ajustés selon la direction de la tendance.
- Les niveaux peuvent être inversés ou étendus selon les paramètres utilisateur.
Paramètres Personnalisables ⚙️
- Seuil de Déviation : Ajuste la sensibilité aux mouvements de prix (basé sur l’ATR).
- Profondeur du Pivot : Définit la plage de barres pour la détection des pivots (affecte la fréquence des signaux).
- Référence Historique : Définit la distance du pivot initial sélectionné pour le TrendFan.
- Visibilité : Active/désactive l’affichage du TrendFan/Fibonacci et sélectionne les niveaux spécifiques à afficher.
Conclusion 🏆
Le Fibonacci Pitchfan est un outil tout-en-un puissant pour les traders cherchant une vue claire et dynamique de la structure du marché. En combinant pivots, lignes de tendance et niveaux de Fibonacci, il fournit des informations exploitables pour anticiper les mouvements de prix et prendre des décisions éclairées. 🚀
Résumé
It generates a "TrendFan" by projecting dynamic trendlines from a configurable historical pivot to the latest pivot, creating a fan of key price zones. Optional Fibonacci retracement and extension levels highlight potential pullback areas and price targets, which can be customized or inverted according to user preferences.
Key customizable settings include deviation threshold sensitivity, pivot depth (bar range for pivot detection), historical reference for the initial pivot selection, and visibility options for TrendFan and Fibonacci levels. This tool is suitable for traders seeking actionable insights to anticipate price movements and make informed decisions based on a comprehensive view of market dynamics.


![Logo de "[Hamster-Coder] Moving Average"](https://cdn.ctrader.com/image/webp/1bd952ad-57d2-4db2-9b49-b01be0b048b8_30113)


![Logo de "[Hamster-Coder] Pivot Points MTF"](https://cdn.ctrader.com/image/webp/4c143e5a-309c-40e3-a578-f04d1e133ffa_31159)


