说明
PatternScanner – cTrader 的自动图表形态检测器
PatternScanner 是一个用于 cTrader 的可视化图表形态检测器,能够自动找到最重要的经典反转结构并直接绘制在您的图表上。
无需逐根K线手动搜索形态,该指标实时扫描波峰和波谷并突出显示:
- 头肩顶 (H&S) – 看跌
- 倒头肩 (INV H&S) – 看涨
- 双顶 (DT) – 看跌
- 双底 (DB) – 看涨
- 狼耳形态 (WOLF) – 一种“类似双顶”的形态,第二个峰略高
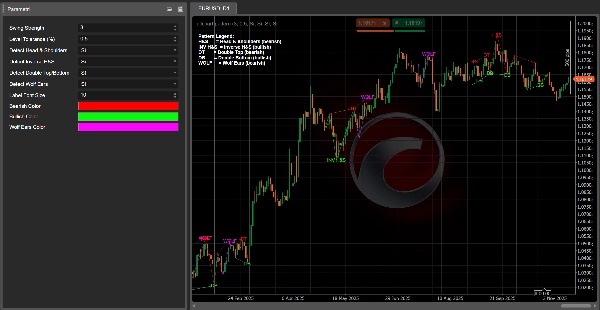
每个形态都标有 标签 (H&S, INV H&S, DT, DB, WOLF) 和一组 线条勾勒结构,您可以一目了然地看到形态,无需猜测。
主要功能
- ✅ 自动检测 波峰和波谷 并从中构建形态
- ✅ 识别 头肩顶 和 倒头肩 并绘制颈线
- ✅ 检测 双顶/双底 并连接两个关键高点/低点
- ✅ 识别 狼耳形态 不与标准双顶信号重叠
- ✅ 绘制 之字形线条 连接波峰波谷,直观勾勒每个形态
- ✅ 内置 图例 位于左上角,解释所有形态代码 (H&S, INV H&S, DT, DB, WOLF)
- ✅ 完全覆盖 – 所有内容均绘制在价格图表上,无需额外子窗口
输入参数
- 波动强度 – 用于确认波峰/波谷的K线数量(枢轴灵敏度)。
- 水平容差 (%) – 两个高点/低点被视为“同一水平”的相似度要求。
- 检测头肩顶 – 启用/禁用头肩顶检测。
- 检测倒头肩 – 启用/禁用倒头肩检测。
- 检测双顶/双底 – 启用/禁用双顶/双底检测。
- 检测狼耳形态 – 启用/禁用狼耳形态检测。
- 标签字体大小 – 图表上形态标签的大小。
- 看跌颜色 – 用于看跌形态(H&S, DT, WOLF)的颜色。
- 看涨颜色 – 用于看涨形态(INV H&S, DB)的颜色。
- 狼耳颜色 – 专用于WOLF形态线条和标签的颜色。
形态绘制方式
- 头肩顶 / 倒头肩
-
- 通过5个关键波动点(肩 – 头 – 肩)绘制之字形线条。
- 颈线 作为虚线趋势线绘制,连接两个低点(头肩顶)或两个高点(倒头肩)。
- 双顶 / 双底
-
- 在第二个顶点/底部标注标签(DT或DB)。
- 连接两个高点(DT)或两个低点(DB)的趋势线。
- 狼耳形态
-
- 通过 高–低–高 结构绘制之字形线条。
- 通过两个峰值绘制虚线阻力线。
- 只有当第二个高点 明显高于 第一个时,才发出狼耳信号,因此不会与普通双顶重叠。
使用方法
将 PatternScanner 附加到任意符号和时间框架上,让它作为主要反转结构的 视觉雷达:
- 发现潜在的 反转区域,包括头肩顶、双顶/双底和狼耳形态
- 结合您自己的过滤器(趋势、成交量、支撑/阻力)进行交易入场
- 使用 左上角的图例 快速识别显示的形态
这不是一个独立的交易系统,而是一个强大的 形态识别工具,节省您的时间,帮助您专注于图表上最有趣的结构。
👉 加入我们的社区
在服务器内您将找到:
- 对本指标及我其他 cTrader 指标/cBots 的支持
- 策略讨论、形态示例和优化思路
- 我发布的更新、新闻和未来工具
摘要
AI 摘要
Pattern Scanner is an indicator for the cTrader platform that automatically detects key classical chart reversal patterns on price charts. It identifies and visually marks Head & Shoulders (bearish), Inverse Head & Shoulders (bullish), Double Top (bearish), Double Bottom (bullish), and Wolf Ears patterns in real time by scanning swing highs and lows. Each detected pattern is outlined with zig-zag lines connecting relevant swing points and labeled directly on the chart for easy recognition. The indicator also draws necklines for Head & Shoulders patterns and trendlines connecting highs or lows for Double Tops/Bottoms and Wolf Ears. A built-in legend explains pattern codes, and all visuals overlay the price chart without requiring additional windows. Users can customize detection parameters such as swing strength, level tolerance, pattern enablement, label font size, and colors for bullish, bearish, and Wolf Ears patterns. Pattern Scanner supports any symbol and timeframe, serving as a visual tool to highlight potential reversal zones for further analysis or trade setup. It is designed to complement other technical filters and is not a standalone trading system.
指标配置
客户评价
4.0
评价:1
5 | 0 % | |
4 | 100 % | |
3 | 0 % | |
2 | 0 % | |
1 | 0 % |
客户评价
November 24, 2025
Pattern Scanner spots the key reversal chart patterns (H&S, Inverse H&S, Double Tops/Bottoms, Wolf Ears) with clean visuals and real-time updates. A great time-saver for pattern traders, enabling quicker identification of structure. Not a standalone signal tool - needs filtering and context. Strong tool for the toolkit.
讨论
常见问答
Signal
Indices
Commodities
GBPUSD
RSI
Bollinger
Fibonacci
Scalping
AI
XAUUSD
NAS100
MACD
BTCUSD
Forex
Breakout
EURUSD
NZDUSD
Martingale
Prop
ZigZag
Supertrend
Fair Value Gap
SMC
Crypto
Grid
Stocks
ATR
USDJPY
VWAP
cTrader Store 提供的所有产品,包括交易机器人、指标和插件,均由第三方开发者提供,仅供信息参考和技术访问之用。cTrader Store 并非经纪商,不提供投资建议、个人推荐或任何未来业绩保证。


价格
42.11M
交易量
6.13M
盈利点数
221
销售
8.37K
免费安装