

Description
## 📊 Qu'est-ce que les cassures de support et résistance ?
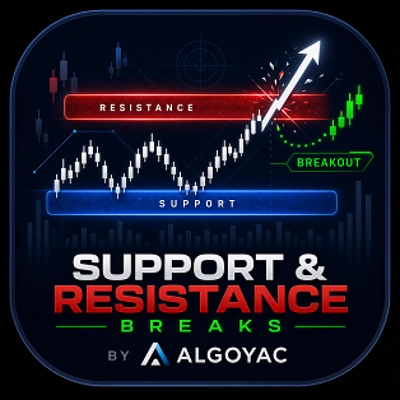
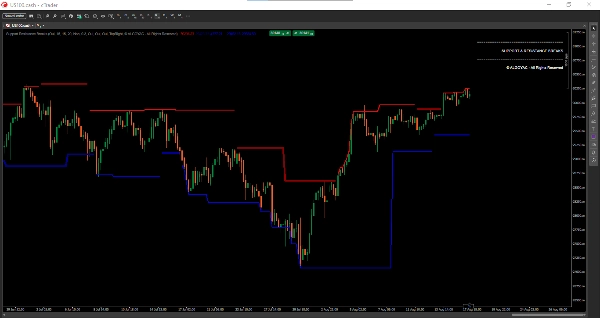
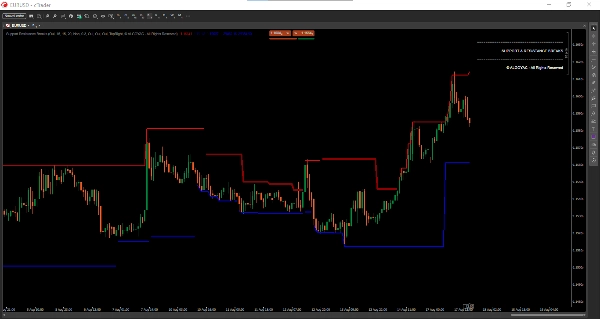
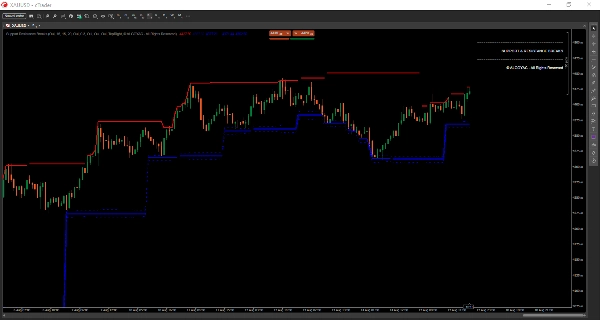
Support & Resistance Breaks est un indicateur de détection de niveau professionnel qui identifie en temps réel les niveaux clés de prix et alerte les traders sur des opportunités de cassure à haute probabilité. Contrairement aux indicateurs traditionnels qui accusent un retard, cet outil détecte les zones de support et de résistance au fur et à mesure de leur formation, permettant aux traders de réagir rapidement aux mouvements du marché.
L'indicateur combine l'analyse des points pivots avec la confirmation du volume et un système de notation sophistiqué pour mettre en évidence uniquement les niveaux les plus significatifs.
## 🎯 Fonctionnalités clés
### 1. Détection des niveaux en temps réel
- **Pas de retard** : Les niveaux sont détectés au moment de leur formation, pas après coup
- **Mises à jour dynamiques** : Support et résistance s'adaptent aux conditions changeantes du marché
- **Ajustement automatique** : Les niveaux se mettent à jour en fonction de l'action des prix
### 2. Notation de la force des niveaux
Chaque niveau reçoit un score de force (0-100%) basé sur :
- **Nombre de touches** (40%) : Nombre de fois où le prix a testé le niveau
- **Volume au niveau** (30%) : Activité de trading proche du niveau
- **Rejet de chandelier** (20%) : Qualité des rejets de prix
- **Fraîcheur du niveau** (10%) : Récence de la formation du niveau
Les niveaux forts (>60%) sont affichés avec des lignes plus épaisses :
- **Rouge/Bleu foncé** : Niveaux forts (haute probabilité)
- **Rouge/Bleu clair** : Niveaux standards (probabilité modérée)
### 3. Zones de support/résistance
- **Taille de zone configurable** : Basée sur un multiplicateur ATR
- **Zones visuelles** : Lignes pointillées montrant la largeur complète de la zone
- **Représentation réaliste** : Les zones reflètent mieux le comportement réel du marché que des lignes uniques
### 4. Notation de la qualité des cassures
Chaque signal de cassure inclut un score de qualité (0-100%) basé sur :
- **Confirmation du volume** (30%) : Pic de volume lors de la cassure
- **Taille du corps du chandelier** (25%) : Force du chandelier de cassure
- **Position de clôture** (25%) : Où le prix a clôturé par rapport à la plage
- **Force du niveau** (20%) : Importance du niveau cassé
**Couleurs de qualité :**
- **Vert citron** : Cassure de haute qualité (>70%)
- **Jaune** : Qualité modérée (40-70%)
- **Orange** : Faible qualité (<40%)
### 5. Signaux de cassure
- **Étiquette "B"** : Cassure avec confirmation de volume
- **"Mèche haussière"** : Rejet haussier du support
- **"Mèche baissière"** : Rejet baissier de la résistance
## 📈 Comment interpréter les signaux
### Confirmation de cassure
Une cassure de haute qualité (étiquette "B" vert citron) avec un volume fort suggère une cassure authentique. Les cassures de faible qualité (orange) peuvent être des faux signaux.
### Test des niveaux
Lorsque le prix teste un niveau à plusieurs reprises (touches multiples), le niveau gagne en force. Les niveaux forts ont plus de chances de tenir ou de provoquer des retournements significatifs.
### Trading en zone
Au lieu de trader des niveaux exacts, utilisez les zones. Entrez près des limites de la zone, pas au milieu.
### Analyse du volume
L'oscillateur de volume (EMA 5 vs EMA 10) aide à confirmer la validité des cassures. Les cassures avec un volume > seuil sont plus fiables.
## ⚙️ Paramètres et réglages
### Groupe Points Pivots
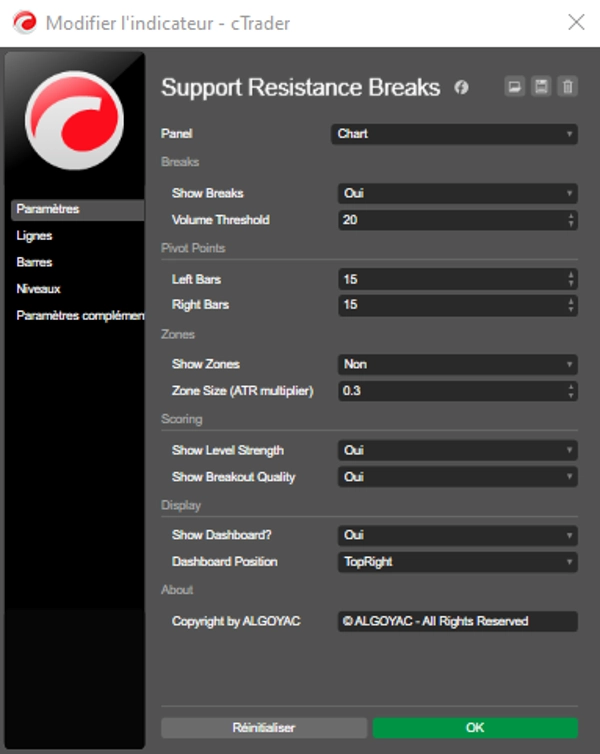
- **Barres à gauche** (par défaut : 15) : Nombre de barres à gauche pour la détection du pivot
- **Barres à droite** (par défaut : 15) : Nombre de barres à droite pour la confirmation du pivot
### Groupe Cassures
- **Afficher les cassures** (par défaut : true) : Afficher les signaux de cassure
- **Seuil de volume** (par défaut : 20) : Valeur minimale de l'oscillateur de volume pour des cassures valides
### Groupe Zones
- **Afficher les zones** (par défaut : true) : Afficher les zones de support/résistance
- **Taille de la zone** (par défaut : 0.3) : Largeur de la zone en multiplicateur ATR
### Groupe Notation
- **Afficher la force des niveaux** (par défaut : true) : Afficher les niveaux forts vs faibles
- **Afficher la qualité des cassures** (par défaut : true) : Afficher les scores de qualité sur les cassures
## 💼 Cas d'utilisation typiques
### Trading intraday
- Utiliser sur les unités de temps M15-H1
- Entrer sur des cassures de haute qualité (étiquettes vert citron)
- Placer les stops au-delà des limites de la zone
- Prendre les profits au niveau de support/résistance suivant
### Swing trading
- Utiliser sur les unités de temps H4-D1
- Se concentrer sur les niveaux forts (>60% de force)
- Attendre que le prix atteigne les zones avant d'entrer
- Utiliser la qualité de la cassure pour confirmation
### Scalping
- Utiliser sur les unités de temps M1-M5
- Trader les rebonds sur les niveaux forts
- Entrées/sorties rapides aux limites des zones
- Confirmation par le volume essentielle
## 👥 Pour qui est cet indicateur ?
### Convient à :
- **Traders de niveaux** : Identifier et trader les niveaux clés
- **Traders de cassures** : Saisir les cassures authentiques avec confirmation de qualité
- **Traders de range** : Trader entre les zones de support et résistance
- **Traders de volume** : Utiliser l'analyse du volume pour confirmation
### Niveau d'expérience :
- **Débutants** : Niveaux et signaux visuels clairs
- **Intermédiaires** : Utiliser la notation pour de meilleures entrées
- **Avancés** : Combiner avec l'analyse multi-timeframe
## ⚠️ Notes importantes et limitations
1. **Faux signaux de cassure** : Toutes les cassures ne réussissent pas. Utilisez les scores de qualité et la confirmation du volume.
2. **Redondance des niveaux** : Trop de niveaux sur les marchés volatils. Ajustez les barres gauche/droite en conséquence.
3. **Largeur des zones** : Les zones peuvent être larges sur les marchés à ATR élevé. Ajustez le paramètre Taille de zone.
4. **Pas autonome** : À utiliser de préférence avec d'autres indicateurs (momentum, analyse de tendance).
5. **Conditions de marché** : Fonctionne mieux dans les marchés en tendance. Les marchés en range peuvent produire de nombreux faux signaux.
## 🔧 Réglages recommandés
| Type de marché | Barres à gauche | Barres à droite | Taille de zone |
|-------------|-----------|------------|-----------|
| Forex | 15 | 15 | 0.3 |
| Actions | 20 | 10 | 0.2 |
| Crypto | 25 | 15 | 0.5 |
| Indices | 15 | 10 | 0.3 |
## 🚀 Pour commencer
1. Ajoutez l'indicateur à votre graphique
2. Observez les niveaux initiaux et leur force
3. Attendez que le prix approche des niveaux forts
4. Surveillez les signaux de cassure avec scores de qualité
5. Entrez sur des cassures de haute qualité (>70%)
6. Utilisez les zones pour le placement des stops
---
Résumé
The indicator displays configurable support and resistance zones using ATR multipliers, providing a realistic market representation beyond single lines. Breakout signals include quality scores derived from volume surges, candle body size, close position, and level strength, with color-coded quality indicators (lime for high, yellow for moderate, orange for low).
Breakout signals are labeled ("B" for volume-confirmed breakouts, "Bull Wick" for bullish rejections, and "Bear Wick" for bearish rejections). Volume oscillators assist in confirming breakout validity. Settings allow customization of pivot detection bars, zone size, and display options.
Suitable for various trading styles—including day trading, swing trading, and scalping—this indicator supports multiple timeframes and markets such as Forex, stocks, crypto, and indices. It is intended for traders of all experience levels seeking to identify and trade key levels, breakouts, and ranges with volume-based confirmation.
Discussion
Avis clients
5 | 50 % | |
4 | 50 % | |
3 | 0 % | |
2 | 0 % | |
1 | 0 % |
























![Logo de "[Hamster-Coder] Bollinger Bands"](https://cdn.ctrader.com/image/webp/21d8e5d6-fb11-4bac-b9ee-cd05c2b76804_30327)
