Description
Indicateur VPD
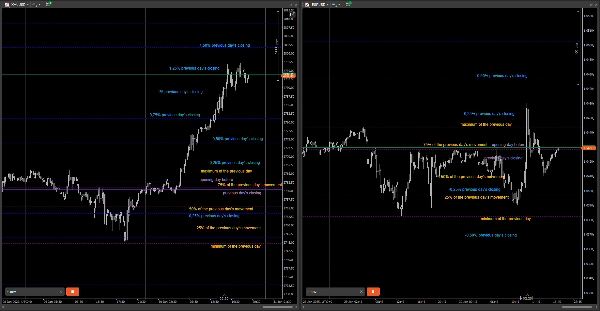
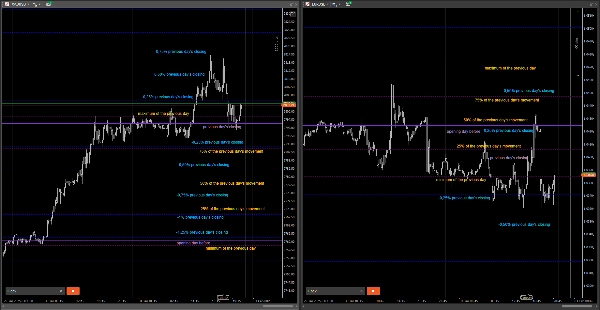
Le VPD est un indicateur recommandé pour ceux qui effectuent des opérations intrajournalières, sur n'importe quel symbole Forex.
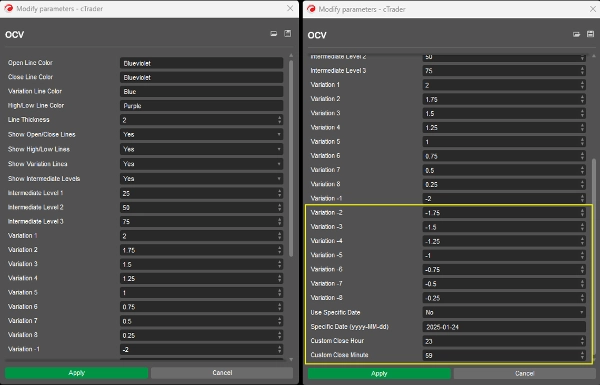
Il consiste en une association de certains paramètres, qui sont :
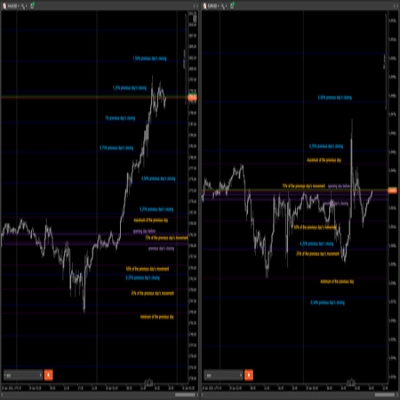
• Ouverture et clôture de la veille ;
• Maximum et minimum de la veille avec les variations des pourcentages intermédiaires de 25 %, 50 % et 75 % (ils sont configurables) de l'ensemble du mouvement de la veille ;
• Variations de prix en pourcentage de la clôture de la veille de -2 %, -1,75 %, -1,50 % ... +1,50 %, +1,75 %, +2 % (ils sont configurables).
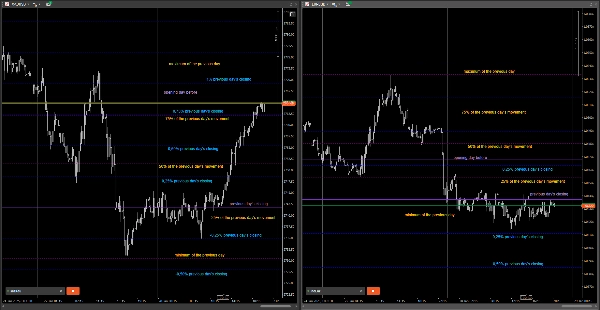
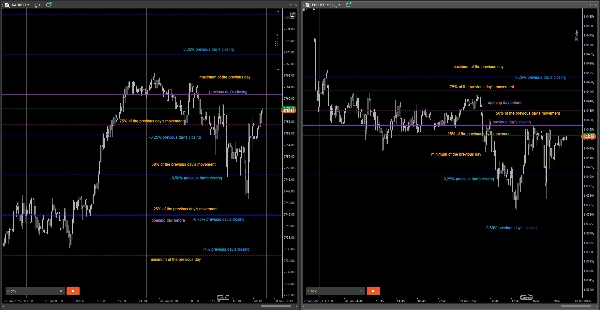
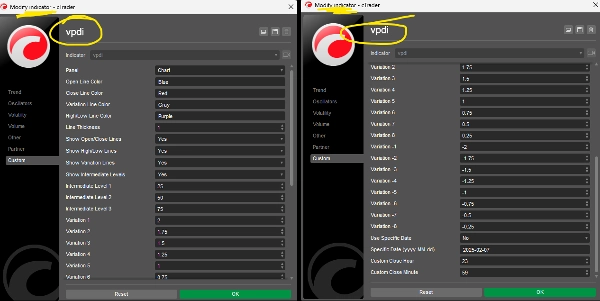
Vous pouvez choisir de changer les couleurs, l'épaisseur des lignes et les pourcentages, ainsi que décider lesquels vous souhaitez afficher sur le graphique, comme dans les exemples ci-dessous.
Si vous souhaitez qu'il s'affiche sur une période spécifique, vous pouvez indiquer la date et l'heure.
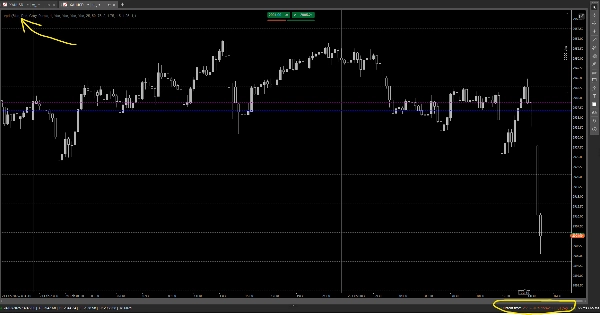
(Sur l'impression, c'est comme cbot, mais plus tard je l'ai changé en indicateur.)
J'ai mis à jour avec une capture d'écran (montrant l'indicateur sur le graphique) à la date d'aujourd'hui (25/02/2025).
E-mail de contact : ortsac.nanido@gmail.com


