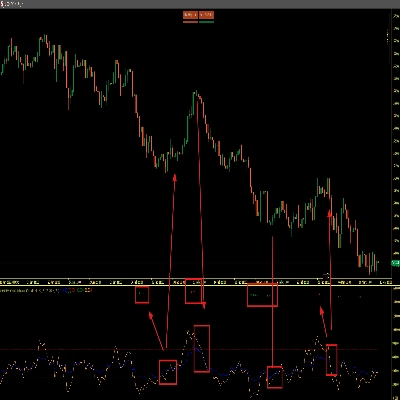
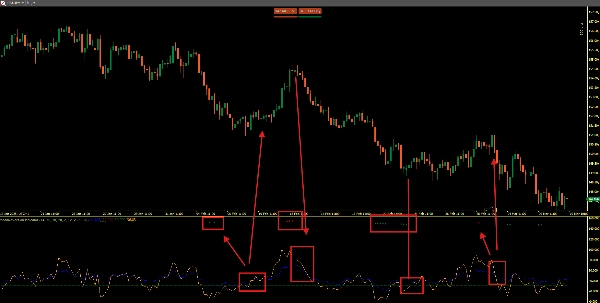
MeanReversion Indicator
Indicateur
142 téléchargements
Version 1.0, Mar 2025
Windows, Mac
4.0
Avis : 1
Depuis le 21/02/2025
466.3M
Volume tradé
180.83K
Pips gagnés
22
Ventes
6.89K
Installations gratuites
Description
Résumé
Profil de l'indicateur
Avis clients
4.0
Avis : 1
5 | 0 % | |
4 | 100 % | |
3 | 0 % | |
2 | 0 % | |
1 | 0 % |
Avis clients
August 12, 2025
Pros: Adaptive moving average combining SMA with dynamic correlation to reduce lag and smooth price noise. Flexible sensitivity settings. Cons: No alerts or tooltips. No template saving. Can produce noise on low-end PCs or very short timeframes.
Discussion
Questions fréquentes
Les produits disponibles sur cTrader Store, notamment les bots de trading, les indicateurs et les plug-ins, sont fournis par des développeurs tiers et mis à disposition à titre informatif et à des fins d'accès technique uniquement. cTrader Store n'est pas un courtier et ne fournit aucun conseil en investissement, aucune recommandation personnelle ni aucune garantie quant aux performances futures.


![Logo de "High-Low Divergence [Iridio Capital]"](https://cdn.ctrader.com/image/webp/443c4661-7abb-40f1-842f-4b6ec560649b_40914)


Prix
Depuis le 21/02/2025
466.3M
Volume tradé
180.83K
Pips gagnés
22
Ventes
6.89K
Installations gratuites