Description
Indicateur robuste de delta cumulatif et de déséquilibre.
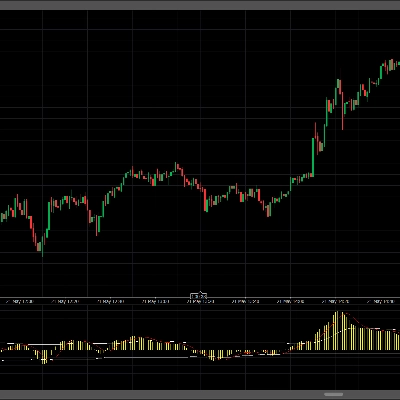
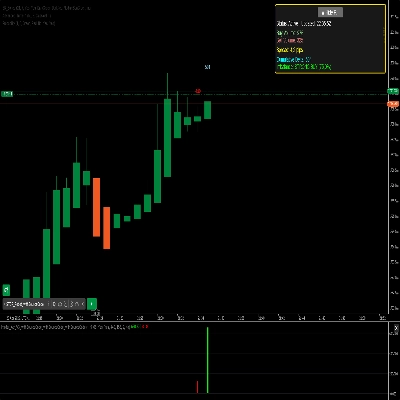
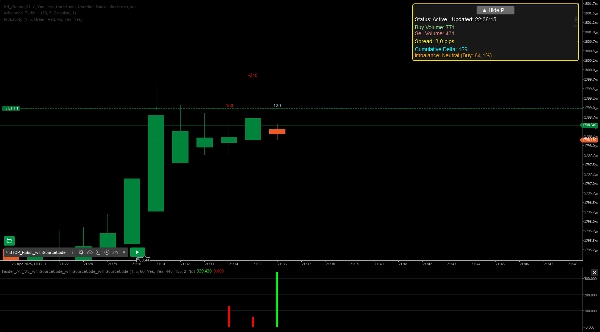
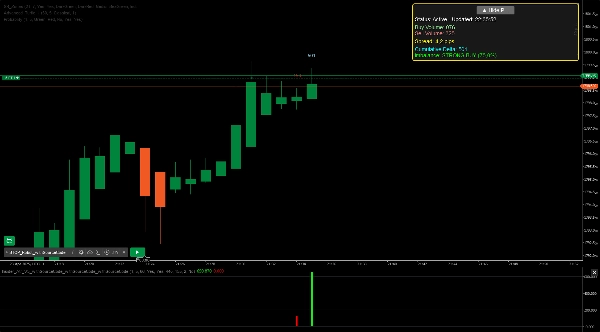
Insider est un indicateur robuste pour cTrader conçu pour analyser les données de profondeur de marché et mettre en évidence les déséquilibres d'achat et de vente en temps réel. Il fournit un retour visuel clair sur le graphique, affichant des métriques clés telles que le volume d'achat/vente, le delta cumulatif et la force du déséquilibre via des histogrammes et un tableau de bord personnalisable. Adaptez-le à votre style de trading avec des réglages ajustables, incluant la période d'affichage, les niveaux de profondeur (1-10) et le seuil de déséquilibre de volume (50-95%). Les fonctionnalités supplémentaires comprennent des alertes optionnelles pour les déséquilibres forts, un filtrage des heures de trading, et un panneau redimensionnable pour une meilleure ergonomie. Idéal pour les day traders et les swing traders, cet indicateur offre des insights précieux sur le sentiment du marché et les mouvements potentiels des prix.
Résumé
Avis clients
5 | 100 % | |
4 | 0 % | |
3 | 0 % | |
2 | 0 % | |
1 | 0 % |