NNFX TP AND SL V1.1
อินดิเคเตอร์
เวอร์ชัน 1.0, Apr 2025
Windows, Mac
5.0
รีวิว: 1

คำอธิบาย
🔹 สิ่งที่ทำ
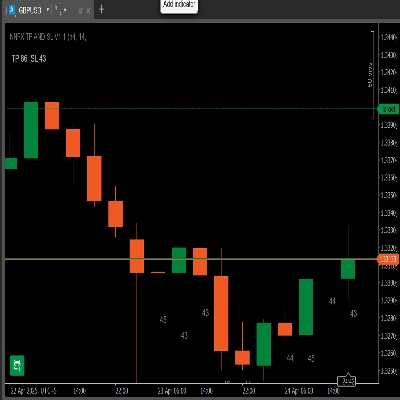
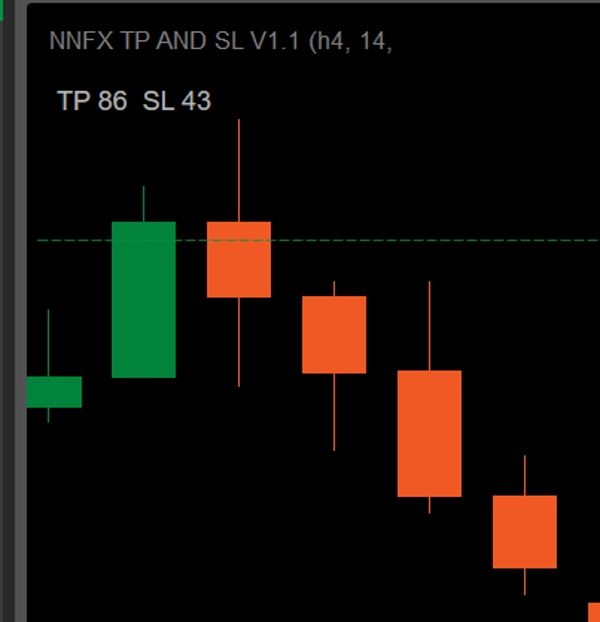
- แผงควบคุมแบบไดนามิก: แสดง “TP × SL” เป็นพิปส์ตามช่วง ATR ที่คุณเลือกและตัวคูณ TP.
- ป้าย ATR 10 แท่งล่าสุด: พิมพ์ค่า ATR เป็นพิปส์ใต้แท่งเทียน 10 แท่งล่าสุด (ในกรอบเวลาที่เหมือนกัน).
- ตรวจสอบกรอบเวลา: หากคุณแนบไว้บนกราฟที่มีกรอบเวลาแตกต่างกัน จะแจ้งเตือนว่า “กรอบเวลาไม่ตรงกัน – ไม่แสดง ATR บนแท่งเทียน.”
🔹 คุณสมบัติหลัก
- การแสดงผลแผงควบคุม
-
- TP = ATR × ตัวคูณของคุณ (เลือก 1 ÷ 4.5 ทีละ 0.5)
- SL = ATR เป็นพิปส์
- ตัวอย่าง: ATR = 43 → SL = 43 พิปส์ หากตัวคูณ = 2 → TP = 86 พิปส์.
- ป้าย ATR ต่อแท่ง
-
- แสดงค่า ATR เป็นพิปส์ใต้แท่งเทียน 10 แท่งล่าสุด.
- ช่วยให้คุณรับรู้ความผันผวนล่าสุดได้ทันที.
- การตรวจสอบกรอบเวลา
-
- วาดป้ายเฉพาะเมื่อกรอบเวลาของกราฟตรงกับการตั้งค่ากรอบเวลา ATR ของคุณ.
- หากไม่ตรงกัน จะมีคำเตือนสีแดงแสดงที่ด้านล่าง.
- การกรองสไปค์ (ตัวเลือก)
-
- เปิดใช้งานตัวกรองค่าเฉลี่ย + k·σ เพื่อจำกัดแท่งที่เกิดการล่มอย่างรวดเร็ว.
- ตั้งค่าตัวคูณ σ ได้ตามต้องการ.
🔹 วิธีติดตั้งและใช้งาน
- ดาวน์โหลด
NNFXATRInfoIndicator_v1.1.algo. - ใน cTrader → Algo → Indicators, คลิก Import Indicator และเลือกไฟล์
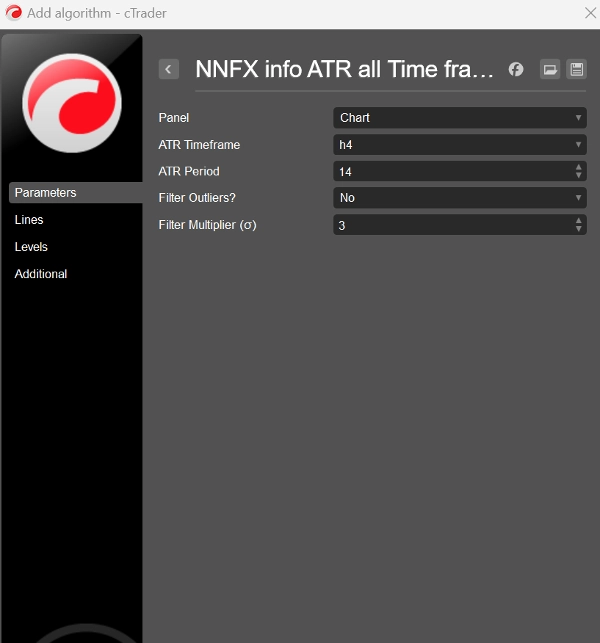
.algo. - เพิ่มลงในกราฟ และเปิดแท็บ Parameters:
-
- กรอบเวลา ATR: เช่น H4
- ช่วง ATR: ค่าเริ่มต้น 14
- ตัวคูณ TP: 1 – 4.5
- ใช้ตัวกรองสไปค์?: ใช่/ไม่ใช่
- ตัวคูณตัวกรอง σ: ค่าเริ่มต้น 3
- คลิก เพิ่มลงในกราฟ คุณจะเห็นแผง “TP × SL” ที่มุมบนซ้ายและป้าย ATR 10 แท่งล่าสุดแสดงขึ้นโดยอัตโนมัติ (ถ้ากรอบเวลาตรงกัน).
🔹 ทำไมคุณจะชอบมัน
- ไม่ต้องคำนวณ: ไม่ต้องแปลงทศนิยมเป็นพิปส์อีกต่อไป—ทุกอย่างเป็นพิปส์เต็ม.
- พร้อมสำหรับ NNFX: SL & TP ถูกกำหนดขนาดตามกฎ ATR ของระบบคุณอย่างแม่นยำ คุณเพียงเลือก กรอบเวลา และ ทิศทางการเทรด ที่คุณต้องการเทรด—แล้วปรับ ตัวคูณ TP ให้เหมาะกับอัตราความเสี่ยง-ผลตอบแทนที่คุณชอบ.
- ชัดเจนและสะอาด: ข้อมูลความผันผวนทั้งหมดในเลเยอร์เดียวที่กะทัดรัด—ไม่มีหน้าต่างเสริม.
- ยืดหยุ่นสูง: คู่เงิน FX ใดก็ได้ กรอบเวลาใดก็ได้ ปรับแต่งได้เต็มที่.
- เพิ่มพลังให้การเข้าตลาด NNFX ของคุณด้วยจุดหยุดและเป้าหมายที่แม่นยำตาม ATR!
สรุป
โปรไฟล์อินดิเคเตอร์
รีวิวจากลูกค้า
5.0
รีวิว: 1
5 | 100 % | |
4 | 0 % | |
3 | 0 % | |
2 | 0 % | |
1 | 0 % |
รีวิวจากลูกค้า
May 3, 2025
the first test should keep DD under 3 percent, and the trade idea gets a pause before execution.
การสนทนา
คำถามที่พบบ่อย
ATR
ผลิตภัณฑ์ที่มีให้บริการผ่าน cTrader Store รวมถึงบอทการเทรด อินดิเคเตอร์ และปลั๊กอิน มีให้บริการโดยนักพัฒนาบุคคลที่สามและมีไว้เพื่อวัตถุประสงค์ในการเข้าถึงข้อมูลและทางเทคนิคเท่านั้น cTrader Store ไม่ใช่โบรกเกอร์และไม่ได้ให้คำแนะนำการลงทุน คำแนะนำส่วนบุคคล หรือการรับประกันผลการดำเนินงานในอนาคต


ราคา
ตั้งแต่ 24/04/2025
27.69M
ปริมาณการเทรด
629.04K
Pips ที่ได้กำไร