Deskripsi
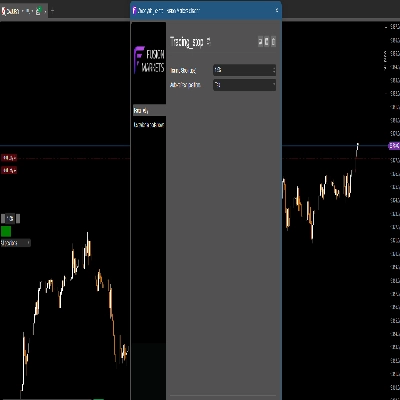
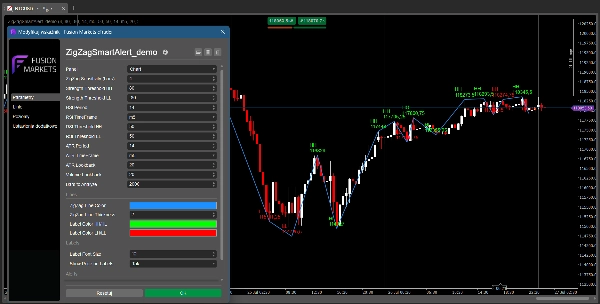
ZigZag Smart Alert DEMO untuk cTrader
VERSI DEMO – uji coba gratis 24 jam!
Ini adalah versi DEMO dari indikator ZigZag Smart Alert untuk cTrader.
Anda dapat menggunakan semua fitur selama 24 jam setelah instalasi.
Setelah masa uji coba, indikator akan kedaluwarsa dan menampilkan pesan.
Untuk mendapatkan versi lengkap, cari "ZigZag Smart Alert" di cTrader Store.
Fitur Utama:
- Peringatan Multi-Filter Pintar:
-
- Terima peringatan suara dan/atau visual hanya saat ayunan baru (HH/LL) muncul dan semua filter kustom Anda terpenuhi (kekuatan candle, RSI, ATR, volume, FVG).
- Panah masuk menunjukkan dengan tepat di mana sinyal terjadi.
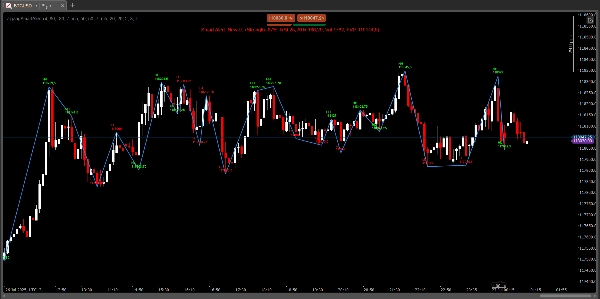
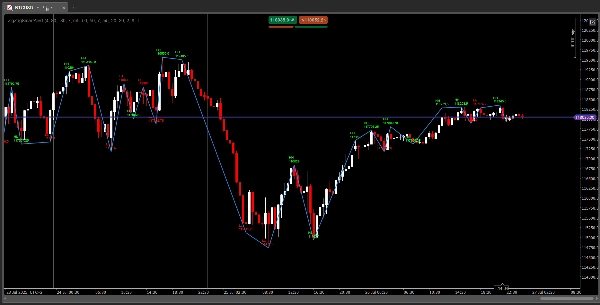
- Struktur ZigZag Klasik:
-
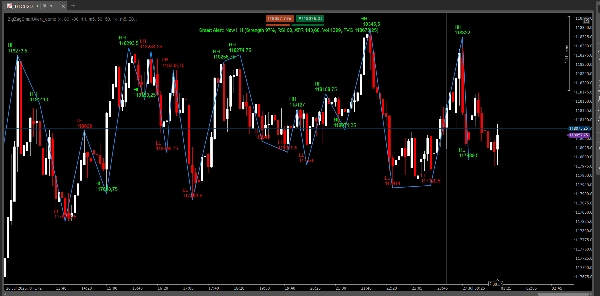
- Mendeteksi dan memberi label semua ayunan tinggi dan rendah (HH, HL, LH, LL) dengan warna dan ukuran font yang dapat disesuaikan.
- Sensitivitas dan ketebalan garis yang dapat disesuaikan.
- Integrasi Fair Value Gap (FVG):
-
- Memberi peringatan hanya saat ayunan dikonfirmasi oleh harga yang ditutup di atas/bawah FVG terdekat.
- Filter RSI, ATR, Volume:
-
- Atur ambang batas dan kerangka waktu Anda sendiri untuk RSI dan ATR.
- Filter sinyal berdasarkan kekuatan candle dan volume tick.
- Ekspor Ayunan ke CSV:
-
- Simpan semua ayunan yang terdeteksi (indeks, waktu, tipe, harga) ke file CSV untuk analisis atau pencatatan lebih lanjut.
- Mudah Digunakan, Sepenuhnya Dapat Disesuaikan:
-
- Semua parameter tersedia di panel pengaturan.
- Bekerja pada instrumen dan kerangka waktu apa pun.
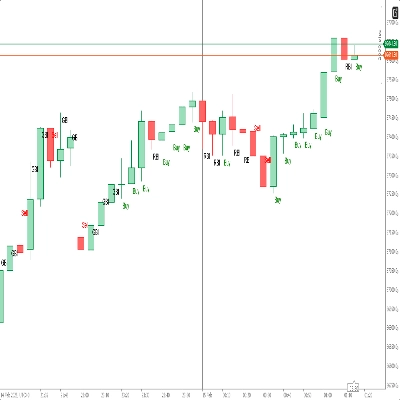
Cara kerjanya:
- Indikator memindai grafik untuk menemukan titik tinggi dan rendah lokal berdasarkan sensitivitas yang Anda pilih.
- Setiap ayunan diberi label sebagai HH, HL, LH, atau LL, dan dihubungkan dengan garis ZigZag.
- Ketika HH atau LL baru muncul dan semua kondisi filter terpenuhi, Anda akan mendapatkan peringatan suara dan/atau visual instan, dan panah masuk digambar di grafik.
- Semua ayunan dapat diekspor ke file CSV untuk catatan Anda.
Pengaturan yang direkomendasikan untuk gaya trading yang berbeda:
Scalping (misal M1, M5):
- Sensitivitas ZigZag: 4
- Periode RSI: 7
- Kerangka Waktu RSI: M5
- Ambang Batas RSI: 80/20
- Periode ATR: 7
- Kerangka Waktu ATR: M1
Daytrading (misal M15, M30):
- Sensitivitas ZigZag: 4
- Periode RSI: 14
- Kerangka Waktu RSI: M15
- Ambang Batas RSI: 70/30
- Periode ATR: 14
- Kerangka Waktu ATR: M15
Swing trading (misal H1, H4):
- Sensitivitas ZigZag: 4
- Periode RSI: 14–21
- Kerangka Waktu RSI: H4
- Ambang Batas RSI: 70/30
- Periode ATR: 14
- Kerangka Waktu ATR: H4
Anda dapat menyesuaikan pengaturan ini agar sesuai dengan strategi dan kondisi pasar Anda sendiri.
Parameter:
- Sensitivitas ZigZag (batang)
- Ambang Batas Kekuatan (untuk HH/LL)
- Periode & Kerangka Waktu RSI, Ambang Batas RSI
- Periode & Kerangka Waktu ATR, Jangka Waktu ATR
- Jangka Waktu Volume
- Warna & Ketebalan Garis ZigZag
- Warna Label & Ukuran Font
- Tampilkan Harga pada Label (ya/tidak)
- Batang untuk Dianalisis
- Aktifkan Peringatan Suara (ya/tidak)
- Aktifkan Peringatan Visual (ya/tidak)
- Aktifkan Ekspor ke CSV (ya/tidak)
Mengapa memilih ZigZag Smart Alert?
- Dapatkan hanya sinyal terbaik – tidak ada lagi gangguan, hanya setup dengan probabilitas tinggi.
- Sempurna untuk strategi price action, SMC, ICT, dan swing trading.
- Lihat dengan tepat di mana harus masuk – dengan panah masuk dan konteks lengkap.
- Mudah digunakan, sepenuhnya dapat disesuaikan, dan tampilan profesional.
Coba ZigZag Smart Alert dan tingkatkan swing trading Anda ke level berikutnya!
Indikator lain oleh penulis ini:
- Candle Timer & Strength DEMO
- Candle Timer & Strength FULL
- Candle Timer & Strength Panel
- FVG MultiTF Tracker
- ZigZag Pro DEMO (tambahkan tautan Anda)
- ZigZag Pro FULL (tambahkan tautan Anda)
📩 Pertanyaan? Saran? Diskon?
Kontak tersedia di profil saya: Robikobud
https://ctrader.com/pl?search=kobud.222&u=kobud.222
http://www.youtube.com/@Robi22-22