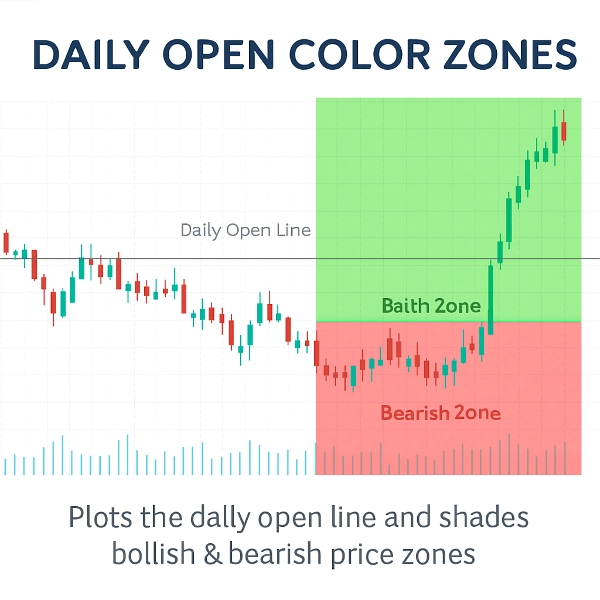
"Daily Open Color Zones Pro_noSourceCode" 标识
Daily Open Color Zones Pro_noSourceCode
"Daily Open Color Zones Pro_noSourceCode" 已上传图片
注册日期 13/09/2025
20
销售
3.9K
免费安装

This indicator is a professional tool designed to plot the Daily Open Line and instantly shade the bullish and bearish price zones around it. Instead of leaving traders guessing, it delivers a clear visual map of market sentiment from the very first of the day. Its goal: to help you instantly identify whether the market is trading above or below the daily open — a key reference point for intraday strategies.

The indicator automatically draws a horizontal line at the daily open price and shades the chart:

Green Zone above the line for bullish territory.

Red Zone below the line for bearish territory.

This simple yet powerful visual cue helps traders quickly assess bias, spot potential reversals, and align trades with the prevailing market direction.

Features

Automatic Daily Open Line: Plots the exact daily open price with precision.

Clear Color Zones: Instantly distinguish bullish and bearish areas with customizable colors and transparency.

Dynamic Updates: Zones adjust automatically with each new candle and chart zoom.

Customizable Appearance: Change line style, thickness, and zone colors to match your chart theme.

Lightweight & Fast: Optimized for minimal CPU usage, even on live accounts with large datasets.

Works on All Symbols & Timeframes: From forex to commodities, indices, and crypto.

Why Use It? The daily open is one of the most watched price levels by professional traders. By visually separating bullish and bearish zones, this indicator gives you an instant read on market sentiment, helping you make faster and more confident trading decisions.

Conclusion This is not just a line on your chart — it’s a visual trading edge. Whether you scalp, day trade, or swing trade, the Daily Open Color Zones indicator will keep you anchored to one of the most important price levels of the day.


Indicator profile
0.0
评价:0
客户评价
该产品尚无评价。已经试过了?抢先告诉其他人!
Scalping
Products available through cTrader Store, including trading bots, indicators and plugins, are provided by third-party developers and made available for informational and technical access purposes only. cTrader Store is not a broker and does not provide investment advice, personal recommendations or any guarantee of future performance.

该作者的其他作品

SuperTrend X cBot is a fully automated trading robot for cTrader built entirely on the power of the SuperTrend indicator
Signal Strike is a professional trading indicator delivers clear, high‑confidence entry signals directly on your chart
Stop Loss Pro – Precision Risk Management for Every Trader
Gold Pulse Pro – An automated trading system for gold (XAUUSD) precisely engineered and powered by advanced algorithms
EMA 21 13 8 Scalper is a fully automated trading system that captures intraday momentum with clarity and discipline
Supertrend RSI ADX is a trading system built for traders who demand precision, control, and steady performance.
indicator showing the Daily Open Line and instantly shading bullish and bearish zones.
Perfect Entry Price designed to help traders identify the most accurate and reliable price levels for market entries
Download Ultimate Trend ADX today and experience a smarter way to track market trends completely free on ctrader
Final Moving Average is an adaptive system designed to keep traders aligned with the true direction of the market
Measure Market Strength at a Glance – Instantly
Gold Predict AI – Advanced Predictive Trading for XAUUSD (M15)

猜您喜欢

The ZigZag indicator is a technical analysis tool primarily used to identify key price reversal points.
The QQE enhances the RSI by incorporating moving averages. This version includes fast and slow trailing levels.
Multi-timeframe ATR, smart swap calculator, range analysis all in one professional panel.
Elliott Wave 2 indicator with Markov probability analysis and a confidence score to assess Wave 3 continuation quality.
Heikin Ashi (Heiken Ashi) - This indicator displays Heikin Ashi candles.
Automate candle numbering for any N-bars and plot the High/Low of the last N periods. Fully customizable & Tab-toggle.
Volume distribution analysis with Market Profile TPO integration.
Opening Price Rays for cTrader
The Floating Risk Indicator is an essential tool for traders who prioritize risk management.
Risk Reward Management Tools(风险回报管理工具)
Optimize exits with Chandelier Exit! Visualize stop-loss points dynamically for improved trading precision and safety.
Advanced price action tool that combines multiple technical analysis concepts
Enhance trading with ATR Bands! Visualize market volatility using dynamic upper and lower ATR bands for precise decision
🔍 Discover All Candlestick Patterns… Absolutely Free!
The Floating Risk Indicator is an essential tool for traders who prioritize risk management.
RANGE DELTA CANDLE VOLUME PROFILE
Fimathe Viewer Indicator - Automated Trend Channels & Levels — Ideal for live trading and backteting
Yen Index
注册日期 13/09/2025
20
销售
3.9K
免费安装