Penerangan
The AdaptiveTrendChannel adalah penunjuk yang membantu anda memvisualisasikan tren pasaran dengan lebih jelas dan dinamik. 📈 Berbeza dengan purata bergerak biasa, ia menyesuaikan secara masa nyata apabila harga berubah, membolehkan anda melihat apabila tren berubah. 🔄
🛠️ Bagaimana Ia Berfungsi?
Perkara pertama yang dilakukan ialah menjana garis rujukan dinamik yang dikemas kini dengan setiap lilin. 🕯️ Anggap garis ini sebagai titik keseimbangan, memberitahu anda sama ada harga berada dalam zon keseimbangan atau bergerak ke arah yang jelas.
Tetapi garis ini tidak berfungsi sendirian! Ia juga bergantung pada tahap dalaman yang berfungsi sebagai sokongan dan rintangan dinamik. 💪 Tahap ini sentiasa menyesuaikan berdasarkan tahap tertinggi dan terendah terkini 📉📈, bermakna ia tidak tetap—ia menyesuaikan dengan keadaan pasaran secara masa nyata.
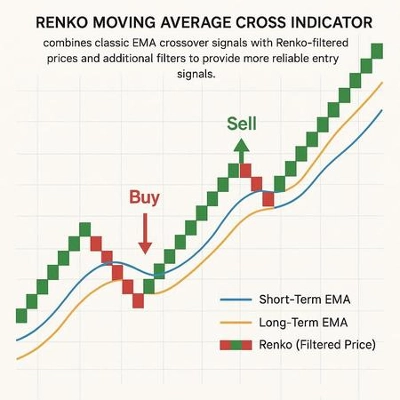
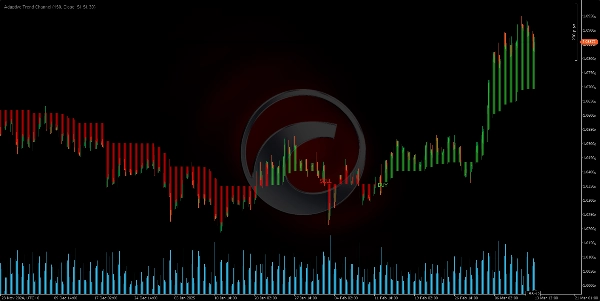
Apabila harga bergerak di atas atau di bawah tahap dinamik ini, penunjuk mengesan perubahan tren dan menjana isyarat. Untuk menjadikan semuanya lebih jelas, ia mewarnakan kawasan antara garis rujukan dan harga penutupan, menjadikan tren jelas secara visual. 🎨👀
📌 Bagaimana Menggunakannya dalam Perdagangan?
Sekarang, bagaimana anda mengaplikasikannya dalam perdagangan sebenar? Mudah.
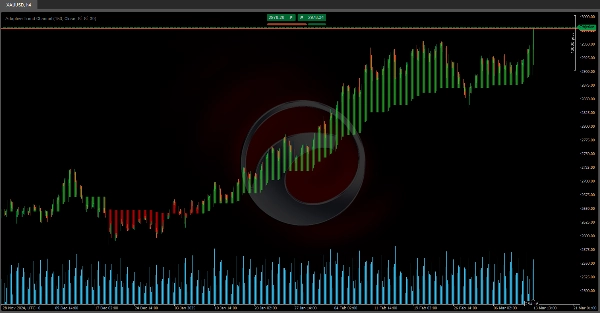
✅ Jika harga kekal di atas garis rujukan untuk beberapa lilin, pasaran dianggap bullish. 🟢
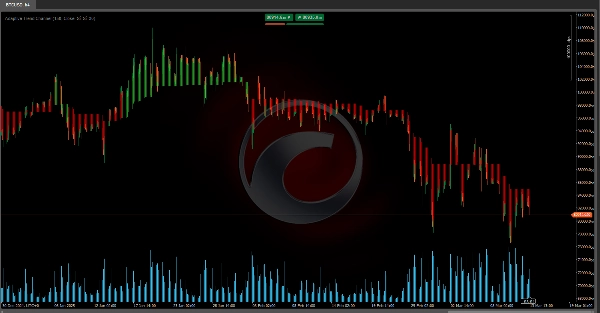
❌ Jika harga jatuh di bawah garis rujukan, pasaran dianggap bearish. 🔴
Oleh kerana garis ini menyesuaikan secara dinamik dan menapis bunyi pasaran, ia memberikan anda pandangan tren yang lebih bersih.
Selain itu, penunjuk ini mengesan persilangan terkini:
🔻 Jika harga melintasi ke bawah tahap dalaman utama, ia menandakan fasa bearish yang berpotensi.
🔺 Jika harga melintasi ke atas tahap dalaman utama, ia menandakan fasa bullish yang berpotensi.
Dengan maklumat ini, penunjuk melakukan dua perkara utama:
🎨 Menukar warna garis dan kawasan carta, memberikan anda petunjuk visual segera mengenai arah tren.
📢 Menjana isyarat beli/jual apabila perubahan tren dikesan.
🔥 Mengapa Ia Sangat Berkuasa?
The AdaptiveTrendChannel membantu anda berada di sisi tren yang betul dan mengelakkan perdagangan bertentangan dengan momentum pasaran. Ia menonjolkan detik penting untuk titik masuk dan keluar, memberikan anda rujukan visual yang jelas untuk membuat keputusan perdagangan yang lebih bijak.
Apabila digabungkan dengan alat lain seperti analisis volum atau tindakan harga, ia menjadi sekutu yang berkuasa untuk menapis perdagangan dan meningkatkan ketepatan masuk. 🚀💰
Penunjuk Kedai Ctrader:
Struktur Pasaran Dinamik
Analisis Titik Perubahan
Regresi Linear Fibonacci
Berbilang Jangka Masa
Bias Lilin Berbilang Tahap
Penjejak
Garis Tren Sokongan dan
Rintangan Auto
Semua Tahap Sokongan dan
Rintangan
Ringkasan
When the price moves above or below these adaptive levels, the indicator detects trend changes and produces buy or sell signals. It visually highlights trends by coloring the area between the reference line and the closing price, providing clear visual cues on trend direction. Traders can interpret price staying above the reference line as bullish and below it as bearish, with the indicator filtering out market noise for a cleaner trend view.
Additionally, the Adaptive Trend Channel tracks recent crossovers of key internal levels to signal potential bullish or bearish phases. It is intended to help traders stay aligned with market momentum and identify key entry and exit points. When combined with other tools like volume analysis or price action, it supports improved trade filtering and entry precision.
Ulasan pelanggan
5 | 100 % | |
4 | 0 % | |
3 | 0 % | |
2 | 0 % | |
1 | 0 % |