Market Swing Structure Pullback Pro
インジケーター
バージョン 1.0、Sep 2025
Windows、Mac
説明
「取引にはリスクが伴います。過去の実績は将来の結果を保証するものではありません。」
概要
AIによる概要
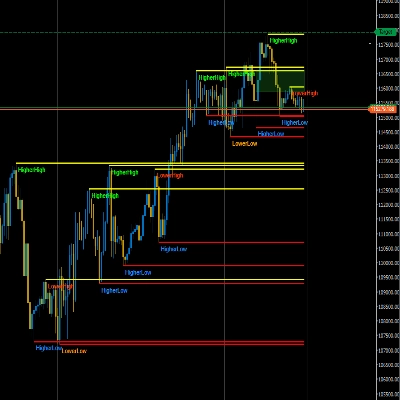
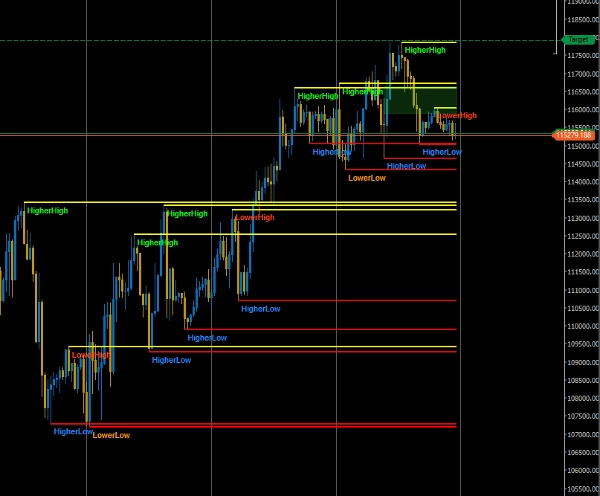
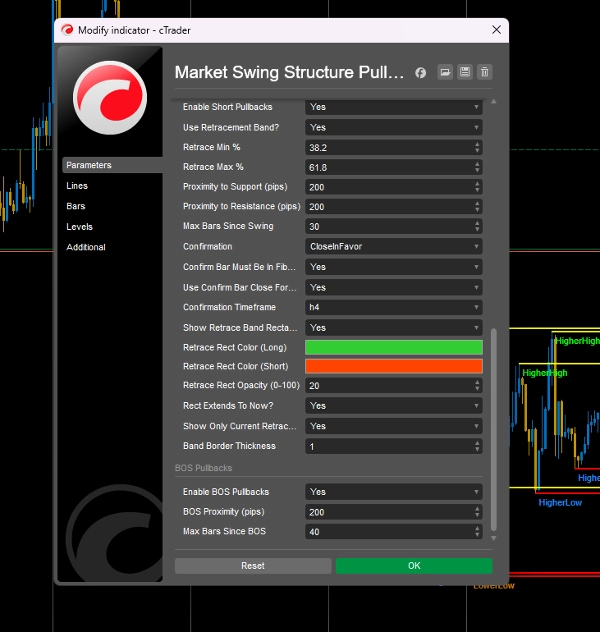
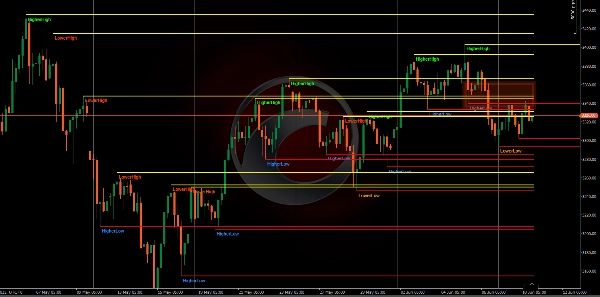
Market Swing Structure Pullback Pro is a trading indicator designed to automatically detect key market levels such as support and resistance and structural points. It highlights pullbacks and break of structure (BOS) retests, providing visual cues for potential trade entries. The indicator incorporates candle confirmation to filter signals, aiming to improve the accuracy of trade setups. It supports multiple markets including Forex, cryptocurrencies (e.g., BTCUSD, ETH), commodities (e.g., gold, oil), indices (e.g., NAS100, SP500), and stocks. Key features include automatic identification of swing structures, highlighting of pullback zones, and integration of candle pattern validation. This tool is intended for use on various symbols and timeframes to assist traders in identifying potential reversal or continuation points based on market structure analysis.
インジケーターのプロフィール
カスタマーレビュー
0.0
レビュー: 0
カスタマーレビュー
この商品にはまだレビューがありません。お使いになったことがある方は、ぜひレビューをお願いします。
ディスカッション
よくあるご質問
BTCUSD
Forex
Signal
Breakout
Indices
EURUSD
Commodities
GBPUSD
NZDUSD
Prop
Supertrend
Crypto
Stocks
XAUUSD
NAS100
USDJPY
cTrader Storeで入手可能な取引ボット、インジケーター、プラグインなどの商品は、第三者の開発者が提供するものであり、情報と技術の取得のみを目的としてご利用いただけます。cTrader Storeはブローカーではなく、投資助言や個人的な推奨を行うことも、将来のパフォーマンスを保証することもありません。


![「[Hamster-Coder] Pivot Points MTF」ロゴ](https://cdn.ctrader.com/image/webp/4c143e5a-309c-40e3-a578-f04d1e133ffa_31159)


価格
登録日 31/10/2024
56
販売
1.75K
無料インストール