
Deskripsi
Ultimate RSI (Relative Strength Index)
The Ultimate RSI adalah osilator canggih dan kustom yang dirancang untuk memberikan pembacaan yang lebih halus, bersih, dan lebih responsif terhadap momentum pasar dan kekuatan tren. Ini merupakan peningkatan signifikan dibandingkan Relative Strength Index (RSI) tradisional, dengan fokus pada penyaringan kebisingan pasar dan meminimalkan sinyal palsu (whipsaws). Hal ini menjadikannya alat yang sangat berharga untuk mengonfirmasi tren dan menentukan titik balik yang dapat diandalkan.
Fitur Utama dan Peningkatan:
- Perhitungan Momentum yang Ditingkatkan: Indikator menggunakan metode canggih untuk menghitung perubahan harga. Alih-alih hanya mengandalkan pergerakan harga harian, sinyal momentum diperkuat secara signifikan ketika harga mencatat harga tertinggi atau terendah baru dalam periode lookback. Proses ini memastikan indikator merespons dengan kuat terhadap breakout nyata sambil mengabaikan pergerakan kecil yang bergejolak.
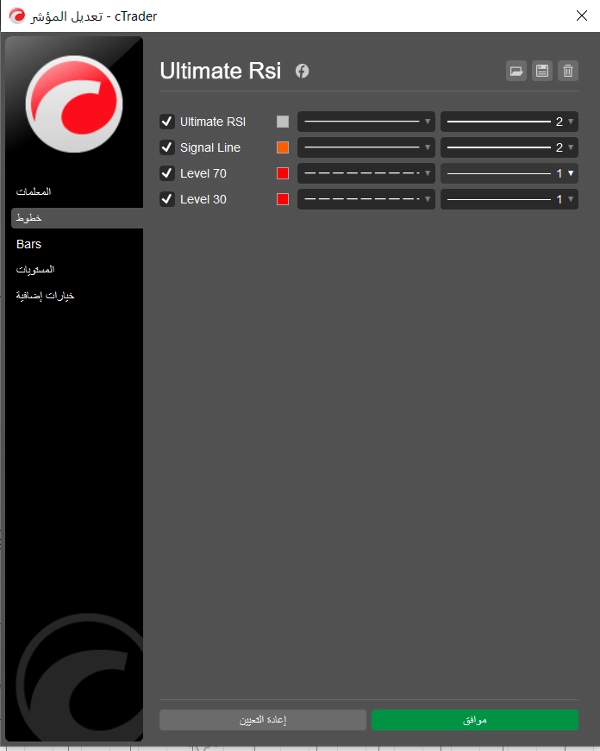
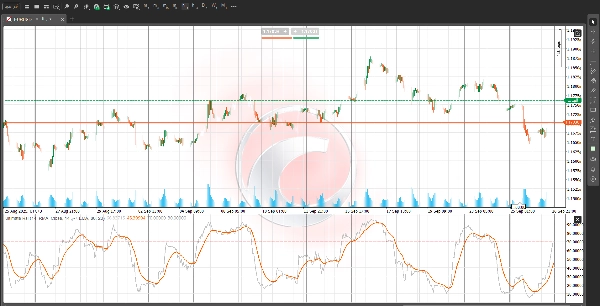
- Garis Sinyal Khusus: Ini mencakup Garis Sinyal yang berbeda (rata-rata bergerak dari RSI itu sendiri) yang dapat dikonfigurasi secara independen. Persilangan antara garis Ultimate RSI dan Garis Sinyalnya sering digunakan sebagai pemicu yang lebih jelas dan dengan kepercayaan lebih tinggi untuk masuk atau keluar, terutama di dekat level jenuh beli/jenuh jual.
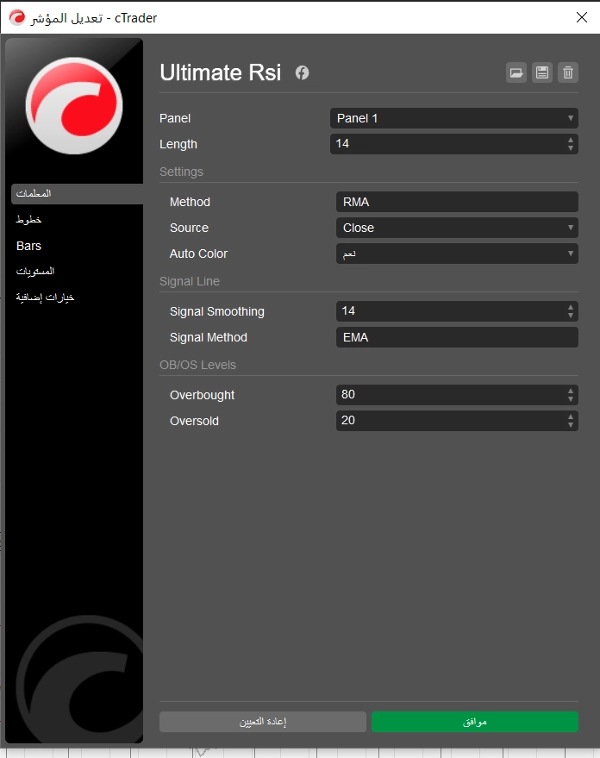
- Metode Pelunakan yang Fleksibel: Pengguna memiliki fleksibilitas untuk memilih jenis pelunakan baik untuk perhitungan RSI maupun Garis Sinyal dari opsi umum: EMA (Exponential Moving Average), SMA (Simple Moving Average), RMA (Wilder's Moving Average), dan TMA (Triangular Moving Average). Ini memungkinkan penyesuaian sensitivitas indikator secara tepat.
- Zona OB/OS Visual: Level jenuh beli (OB) default pada 80 dan level jenuh jual (OS) pada 20 ditandai dengan jelas menggunakan bayangan latar belakang. Dalam pasar yang sangat tren, pembacaan yang bertahan dalam zona ini sering menunjukkan kekuatan tren yang luar biasa daripada pembalikan segera, menawarkan alat konfirmasi yang kuat untuk strategi mengikuti tren.
Cara Berdagang dengan Ultimate RSI:
- Konfirmasi Tren: Gunakan level 50 sebagai pusat momentum. Pembacaan yang konsisten di atas 50 mengonfirmasi bias bullish, sementara pembacaan di bawah 50 mengonfirmasi bias bearish.
- Sinyal Masuk: Cari garis Ultimate RSI yang menembus di atas Garis Sinyal untuk potensi entri panjang, dan menembus di bawah Garis Sinyal untuk potensi entri pendek, dengan memperhatikan dengan cermat di mana persilangan ini terjadi relatif terhadap level 50.
- Pengurangan Kebisingan: Dengan menekankan perluasan rentang yang sebenarnya dan menggunakan pelunakan canggih, Ultimate RSI membantu trader menjaga fokus selama periode konsolidasi, mencegah entri atau keluar yang prematur.
Penafian: Deskripsi ini hanya untuk tujuan informasi dan edukasi. Perdagangan melibatkan risiko, dan semua pembacaan indikator harus dikombinasikan dengan analisis aksi harga yang komprehensif untuk setiap keputusan perdagangan.
Ringkasan
Users can customize smoothing methods for both the RSI and Signal Line using EMA, SMA, RMA, or TMA, allowing precise control over sensitivity. The indicator visually marks overbought (80) and oversold (20) zones with background shading, aiding in identifying strong trend conditions rather than immediate reversals. Traders can use the 50-level as a momentum center to confirm bullish or bearish bias, and rely on crossovers between the Ultimate RSI and its Signal Line for potential trade entries or exits. By emphasizing true range expansion and advanced smoothing, the Ultimate RSI helps maintain focus during consolidation phases, supporting trend confirmation and reliable turning point identification across markets including forex, stocks, indices, commodities, and cryptocurrencies.