
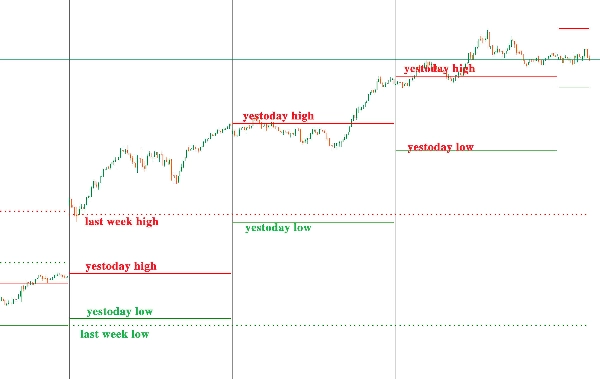
Indikator "Daily Levels" digunakan untuk menampilkan harga tertinggi/terendah minggu lalu dan harga tertinggi/terendah kemarin di berbagai kerangka waktu.
Harga tertinggi/terendah minggu lalu: Ditandai dengan garis putus-putus tebal;
Harga tertinggi/terendah kemarin: Ditandai dengan garis solid tipis.
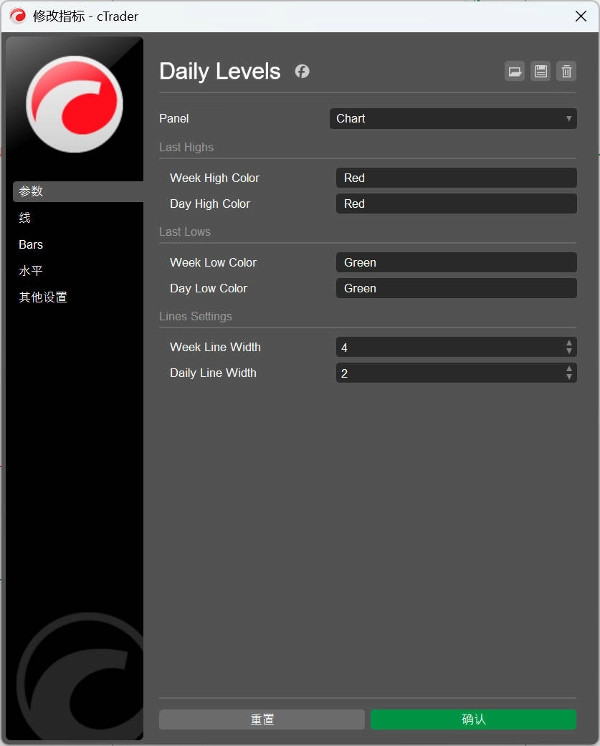
Pengguna dapat menyesuaikan warna dan ketebalan garis.
“Daily Levels”指标用于在不同的时框框架下显示上周最高价/最低价和昨天最高价/最低价。
上周最高/最低价:使用粗虚线标注;
昨天最高/最低价:使用细实线标注。
用户可以自定义颜色和线条粗细。
Profil indikator
0.0
Ulasan: 0
Ulasan pelanggan
Belum ada ulasan untuk produk ini. Sudah mencobanya? Jadilah pemberi ulasan pertama!
Forex
Signal
Breakout
Indices
Commodities
Crypto
Produk-produk yang tersedia melalui cTrader Store, termasuk bot trading, indikator, dan plugin, disediakan oleh pengembang pihak ketiga serta hanya ditujukan untuk akses teknis dan informasi. cTrader Store bukan broker dan tidak menyediakan saran investasi, rekomendasi pribadi, atau jaminan apa pun tentang kinerja di masa mendatang.


![Logo "[Hamster-Coder] Bollinger Bands"](https://cdn.ctrader.com/image/webp/21d8e5d6-fb11-4bac-b9ee-cd05c2b76804_30327)


Sejak 30/09/2024
44
Penjualan