
Free Smart Money Concepts (SMC) from TradingView
Indikator
3.25K unduhan
Versi 1.0, Oct 2025
Windows, Mac
5.0
Ulasan: 8
Deskripsi
- 🔷 Apa itu Smart Money Concepts (SMC)?
- SMC adalah kerangka kerja aksi harga yang berfokus pada bagaimana “smart money” institusional mengakumulasi dan mendistribusikan posisi.
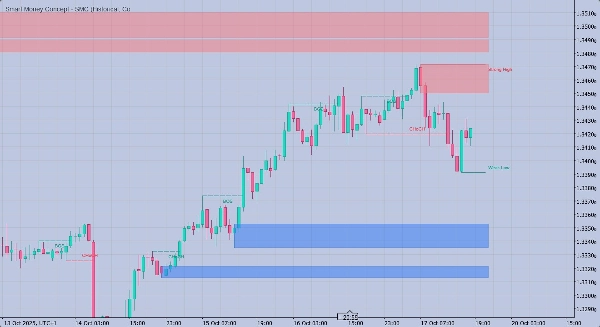
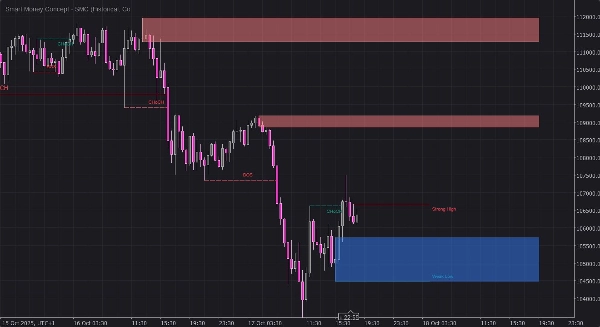
- Ini menggantikan pola dasar dengan peta logis dari struktur pasar (BOS/CHoCH), likuiditas (EQH/EQL), Order Blocks (OB), Fair Value Gaps (FVG), dan zona premium/diskon untuk mengantisipasi kelanjutan atau pembalikan yang mungkin terjadi.
- 🚀 Apa yang dilakukan indikator ini
- Mendeteksi Break of Structure (BOS) dan Change of Character (CHoCH) baik pada struktur swing maupun internal.
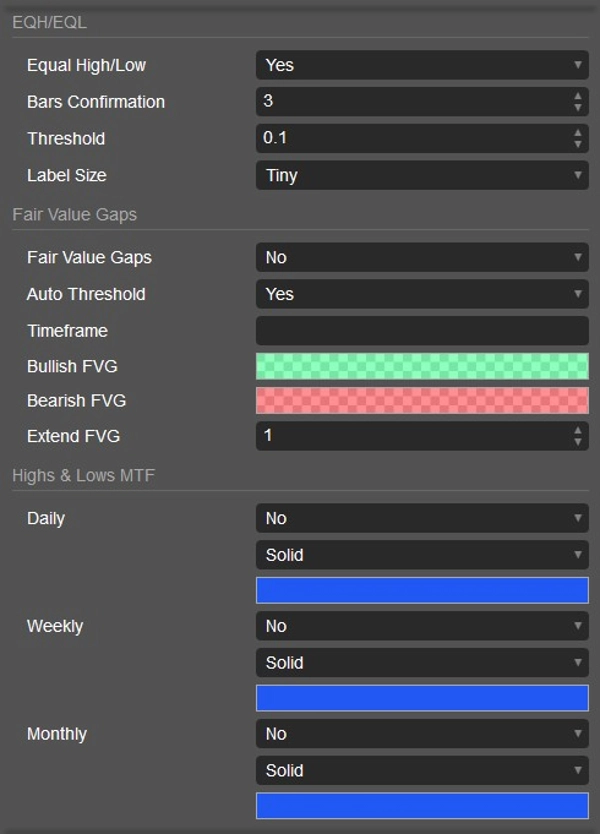
- Menggambar Order Blocks (OB) dan Fair Value Gaps (FVG) sebagai zona semi-transparan (warna RGBA—opasitas sepenuhnya dikontrol pengguna).
- Menandai Equal Highs/Equal Lows (EQH/EQL) untuk menunjukkan kumpulan likuiditas.
- Memberi label Strong/Weak High/Low sehingga Anda dapat melihat sisi mana yang kemungkinan menjadi target atau dilindungi.
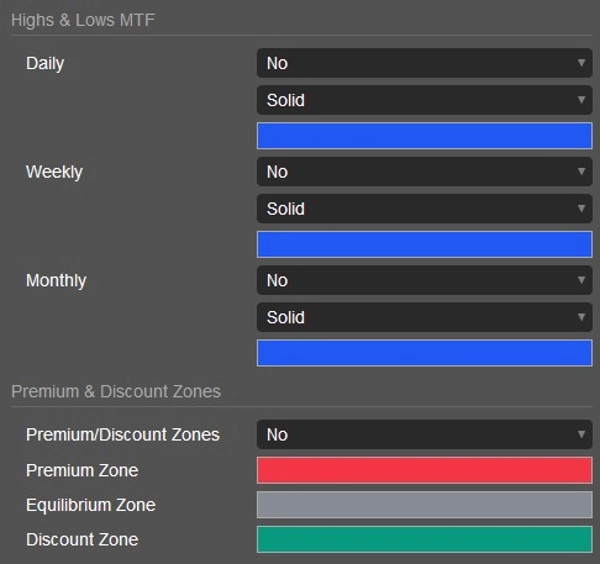
- Memetakan zona Premium/Equilibrium/Discount di seluruh rentang swing saat ini untuk konteks area nilai.
- Menimpa high & low Harian/Mingguan/Bulanan untuk konfluensi multi-timeframe.
- Menawarkan mode gambar Saat Ini/Historis dan gaya Monokrom/Berwarna.
- 🧭 Cara menggunakannya (alur kerja praktis)
- 1) Baca struktur terlebih dahulu:
-
- Cari BOS/CHoCH pada level swing dan internal untuk menetapkan bias.
- BOS bullish + BOS internal sering menandakan kelanjutan; CHoCH memperingatkan potensi pembalikan.
- 2) Petakan ketidakseimbangan dan blok:
-
- Gunakan FVG sebagai “target efisiensi” di mana harga sering menyeimbangkan kembali.
- Gunakan OB sebagai zona mitigasi yang mungkin di mana entri dapat terbentuk (misalnya, entri limit atau konfirmasi).
- 3) Sesuaikan dengan likuiditas:
-
- Perhatikan EQH/EQL untuk penyapuan likuiditas; penyapuan + BOS adalah narasi SMC yang kuat.
- Catat Strong/Weak High/Low untuk menilai sisi mana yang rentan.
- 4) Tambahkan konfluensi:
-
- Periksa premium/diskon: setup beli memiliki probabilitas lebih tinggi di diskon; setup jual di premium.
- Tambahkan level MTF (D/W/M) dan waktu sesi Anda sendiri untuk presisi.
- 5) Eksekusi dan kelola:
-
- Entri: mitigasi OB atau pengisian FVG dengan penyelarasan struktur.
- Stop: di luar pembatalan OB/FVG atau pivot kuat terbaru.
- Target: likuiditas berlawanan, OB/FVG lawan, atau keseimbangan swing.
- ⚙️ Pengaturan utama yang Anda kendalikan
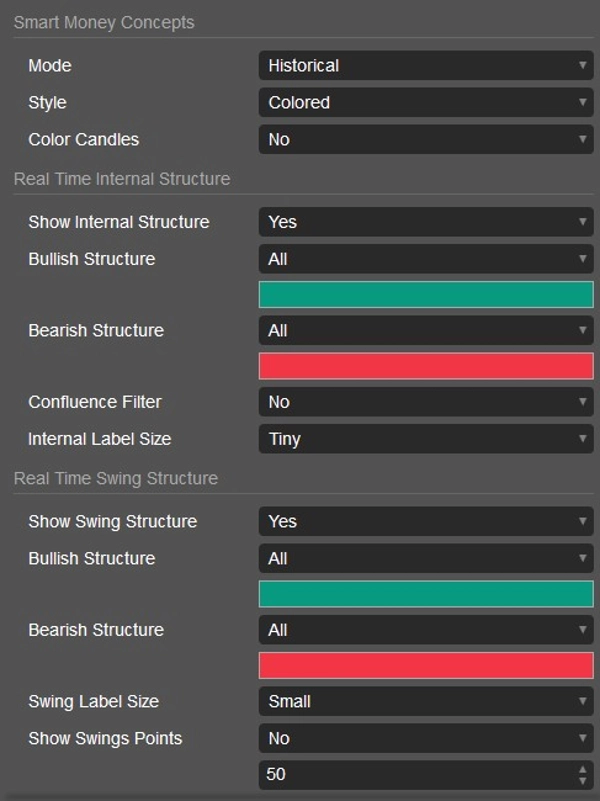
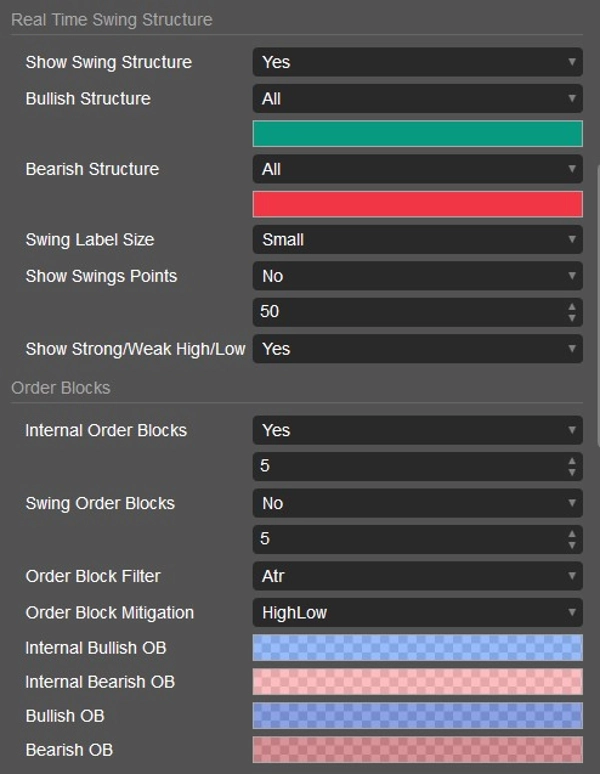
- Mode: Historis vs Saat Ini (tampilan waktu nyata yang bersih).
- Filter struktur: Tampilkan BOS/CHoCH untuk swing vs internal; ukuran label; konfluensi opsional (logika wick).
- Warna OB/FVG: Pilih warna RGBA apa saja; saluran alfa mengatur transparansi secara langsung.
- Jumlah/batas: Jumlah maksimum OB yang terlihat; ekstensi FVG; sensitivitas EQH/EQL.
- Level MTF: Aktifkan Harian/Mingguan/Bulanan dan pilih gaya garis.
- Gaya: Berwarna atau Monokrom, plus pewarnaan candle opsional berdasarkan tren.
- 🧩 Mengapa trader menyukainya
- Logika paritas 1:1 dengan pendekatan SMC TradingView yang populer (BOS/CHoCH, paritas OB/FVG).
- Visual yang bersih: zona dan label tetap terbaca dan diperbarui dengan mulus secara waktu nyata.
- Fleksibel: bekerja untuk scalping hingga swing trading, pada simbol atau timeframe apa pun yang didukung oleh cTrader.
- ✅ Praktik terbaik
- Gabungkan konteks SMC dengan manajemen risiko dan buku panduan yang jelas (aturan entri, stop, target).
- Gunakan peringatan atau daftar pantauan di sekitar level HTF dan pembukaan sesi untuk pergerakan berkualitas lebih tinggi.
- Selalu validasi dengan sesi pasar dan kalender berita untuk menghindari volatilitas acak.
- 📌 Catatan
- Visual bergantung pada data broker (feed bid/sesi dapat bervariasi).
- Alat ini bukan nasihat keuangan; trading melibatkan risiko. Gunakan di akun demo sebelum live.
Ringkasan
Ringkasan AI
Free Smart Money Concepts (SMC) indicator for cTrader replicates the TradingView SMC framework, focusing on institutional price action analysis. It identifies key market structure elements such as Break of Structure (BOS) and Change of Character (CHoCH) on both swing and internal levels to help establish trading bias. The indicator visually marks Order Blocks (OB) and Fair Value Gaps (FVG) as semi-transparent zones, highlighting potential entry and mitigation areas. It also detects Equal Highs/Lows (EQH/EQL) to indicate liquidity pools, and labels strong or weak highs and lows to assess market vulnerability.
Additional features include plotting premium, equilibrium, and discount zones within the current swing range for value-area context, and overlaying daily, weekly, and monthly highs and lows for multi-timeframe confluence. Users can customize drawing modes (present or historical), color schemes (monochrome or colored), and opacity levels for OB/FVG zones. The indicator supports flexible use across all symbols and timeframes available in cTrader, suitable for scalping to swing trading.
The workflow involves reading market structure, mapping imbalances and blocks, aligning with liquidity, adding confluence from premium/discount zones and multi-timeframe levels, and executing trades with defined entry, stop, and target rules. Visuals depend on broker data feeds. This tool is intended for analysis and does not provide financial advice.
Profil indikator
Ulasan pelanggan
5.0
Ulasan: 8
5 | 100 % | |
4 | 0 % | |
3 | 0 % | |
2 | 0 % | |
1 | 0 % |
Ulasan pelanggan
July 6, 2026
May 23, 2026
March 4, 2026
December 11, 2025
November 4, 2025
Superfantastic 3 in one zones, one of the best indicators on here ,and for free. If you cant figure it out after this, you got something wrong with ya :). Nicely done my friend, how did you code it C# or python?
Diskusi
Pertanyaan umum
BTCUSD
Forex
Signal
Breakout
Indices
EURUSD
Commodities
GBPUSD
NZDUSD
Fibonacci
Prop
ZigZag
Scalping
Fair Value Gap
SMC
Crypto
Stocks
XAUUSD
NAS100
ATR
USDJPY
Produk-produk yang tersedia melalui cTrader Store, termasuk bot trading, indikator, dan plugin, disediakan oleh pengembang pihak ketiga serta hanya ditujukan untuk akses teknis dan informasi. cTrader Store bukan broker dan tidak menyediakan saran investasi, rekomendasi pribadi, atau jaminan apa pun tentang kinerja di masa mendatang.


![Logo "Gaussian Channel [Iridio Capital]"](https://cdn.ctrader.com/image/webp/7c039209-5573-4a54-a072-f9528b503103_41960)


Harga
46
Penjualan
3.97K
Instal gratis