説明
TRB — ティックランバーインジケーター
価格変動前の市場情報を検出
早期導入者向けの期間限定導入価格 - 初期リリース期間終了後に標準小売価格に戻る前に、割引価格で今すぐコピーを確保してください。
バージョン 1.1
詳細はコメント欄をご利用ください
購入後にセットアップガイド付きのビデオセッションが利用可能
TICK RUNS BARS (TRB) インジケーター
Tick Runs Barsは、取引フローの方向性の持続性を検出することで市場のマイクロストラクチャ分析を拡張します。また、Marcos López de PradoのAdvances in Financial Machine Learningに基づき、このインジケーターは一方的な市場圧力が予想レベルから逸脱するタイミングを特定し、機関投資家の注文分割や協調取引活動を明らかにします。
核心の洞察
機関投資家は大口注文を戦略的に実行します — 注文を小分けにしたり、アイスバーグ注文でボリュームを隠したり、アルゴリズム実行を使って市場を動かさないようにします。これらの戦術は、持続的な一方向の取引ランとして明確な痕跡を残します。Tick Runs Barsは、どれだけ長く一方が注文フローを支配しているかを測定することでこれらのパターンを検出し、ランダムな価格変動ではなく意図的で積極的な注文が行われていることを明らかにします。
仕組み
このインジケーターは買いランボリュームと売りランボリュームの長さを別々に計算します — 従来の不均衡指標のように相殺しません。過去の買い/売り確率と平均ボリュームから導出される動的な期待閾値に対して、最大の一方向ボリューム蓄積(θT)を追跡します。実際の方向性ランが期待を超えると、新しいTRBバーがトリガーされます。これにより、注文フロー実行の「構造的形状」— 機関投資家の活動の署名 — が明らかになります。
主な特徴
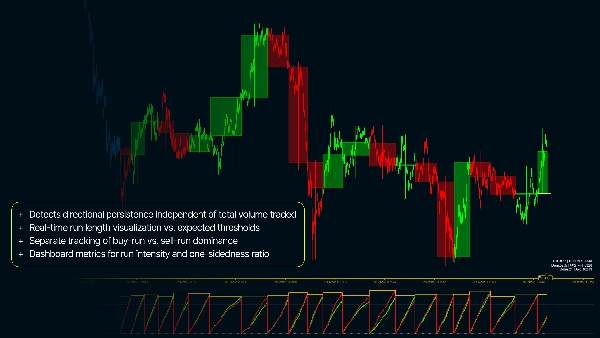
- 取引総量に依存しない方向性の持続性を検出
- 期待閾値に対するリアルタイムのラン長可視化
- 買いランと売りランの支配を別々に追跡
- 注文実行フェーズを示すTRBメンバーシップによるチャートキャンドルの色分け
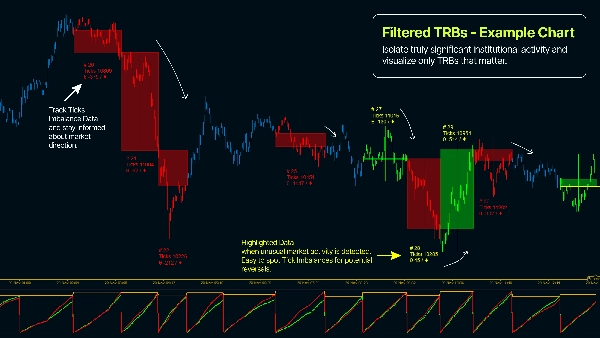
- 真に重要な機関活動を分離するための最小ボリュームフィルター
- ランの強度と一方向性比率のダッシュボード指標
- 銘柄のボラティリティに適応した期待バーサイズとEWMAパラメータの設定可能
なぜTick Runs Barsを使うのか?
- 完了前にリアルタイムで機関注文の実行を特定
- フロー分析を通じて隠れた流動性やアイスバーグ注文パターンを検出
- 協調取引とランダムな市場ノイズを区別
- 統計的異常だけでなく、構造的な注文不均衡から価格変動を捉える
- 既知の機関参加期間中のエントリー/エグジットのタイミングを捉える
- 高度な市場マイクロストラクチャ理論を適用し、より速い時間軸で優位性を獲得
- 小規模な個人投資家の取引スパイクによる誤信号を減少


