
Deskripsi
📌 Apa yang Dilakukan Indikator
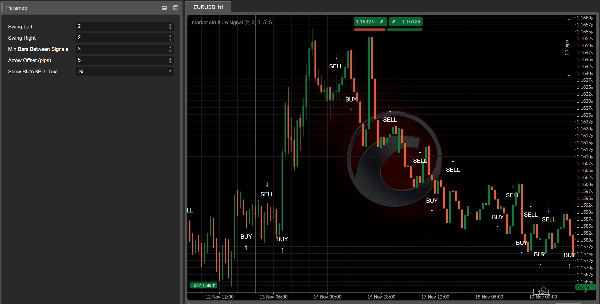
MarketStructureOscSignals adalah alat sinyal aksi harga murni.
Ini:
- Mendeteksi puncak ayunan dan lembah ayunan menggunakan lookback kiri/kanan.
- Melacak apakah ayunan tersebut membentuk:
-
- Higher Highs + Higher Lows → struktur bullish
- Lower Highs + Lower Lows → struktur bearish
- Ketika struktur berubah:
-
- Dari bearish → bullish → ia menampilkan sinyal BELI
- Dari bullish → bearish → ia menampilkan sinyal JUAL
Jadi setiap sinyal mewakili perubahan nyata dalam struktur pasar, bukan hanya persilangan rata-rata bergerak.
⚙️ Input & Cara Mengaturnya
1. Swing Left / Swing Right
Ini mengontrol seberapa “ketat” puncak/lembah ayunan.
- Swing Left (default 2)
Jumlah bar di kiri ayunan yang harus memiliki puncak lebih rendah (untuk puncak ayunan) atau lembah lebih tinggi (untuk lembah ayunan). - Swing Right (default 2)
Jumlah bar di kanan yang juga harus mengonfirmasi ayunan.
Cara menggunakan:
- Nilai kecil (1–2):
-
- Lebih banyak ayunan, lebih banyak sinyal
- Bekerja dengan baik pada timeframe lebih tinggi (H1, H4, D1)
- Nilai besar (3–4+):
-
- Hanya perubahan struktural utama
- Sinyal lebih sedikit tapi lebih kuat
- Baik pada timeframe lebih rendah untuk menghindari noise
2. Min Bars Between Signals
Jumlah minimum bar yang harus berlalu antara dua sinyal.
- Menghindari pengelompokan panah pada setiap pullback kecil.
- Contoh:
-
- Ditetapkan ke
3→ setidaknya 3 bar antara satu sinyal dan berikutnya. - Pada grafik sangat cepat (M1–M5) Anda mungkin ingin
5–10. - Pada H1 atau lebih tinggi,
2–3biasanya cukup.
- Ditetapkan ke
3. Arrow Offset (pips)
Seberapa jauh panah dan label ditempatkan dari candle (dalam pips).
- Untuk Forex:
-
5–10pips biasanya terlihat bagus.
- Untuk indeks (US500, US100, dll.):
-
- Gunakan offset yang lebih besar (misal 20–50 “pips” tergantung ukuran pip broker).
Jika panah tumpang tindih dengan candle, tingkatkan nilai ini.
Jika terlalu jauh, kurangi.
4. Show BUY/SELL Text
true→ menampilkan panah (↑/↓) dan teks “BUY” atau “SELL”.false→ hanya panah.
Jika grafik terasa penuh, Anda dapat menyembunyikan teks dan hanya menampilkan panah.
🔍 Bagaimana Sinyal Dihasilkan (Logika)
Secara internal indikator:
- Melacak dua puncak ayunan terbaru dan dua lembah ayunan terbaru:
-
_prevHigh,_lastHigh_prevLow,_lastLow
- Dari sini diperiksa:
-
- Apakah puncak dan lembah keduanya naik?
-
- → tren bullish (
StructureTrendSignal.Bullish)
- → tren bullish (
- Apakah puncak dan lembah keduanya turun?
-
- → tren bearish (
StructureTrendSignal.Bearish)
- → tren bearish (
- Jika tidak sejajar, tren sebelumnya dipertahankan.
- Setiap kali tren struktural berubah:
-
Bearish → Bullish→ sinyal BELIBullish → Bearish→ sinyal JUAL
- Ini juga memastikan:
-
- Tren tidak
Unknown(jadi bukan di awal sekali). - Cukup bar telah berlalu sejak sinyal terakhir (
MinBarsBetweenSignals).
- Tren tidak
Ini berarti setiap panah menandai pergeseran struktural nyata, bukan noise acak.
📈 Cara Membaca Sinyal BELI/JUAL di Grafik
✅ Sinyal BELI
Apa yang Anda lihat:
- Sebuah panah ke atas
↑di bawah candle - Opsional teks “BELI” dekat panah
Apa artinya:
- Struktur berubah dari bearish → bullish.
- Puncak dan lembah ayunan terbaru sekarang keduanya naik.
- Pasar kemungkinan sedang bertransisi ke tren naik baru atau melanjutkan struktur bullish.
Cara menggunakannya:
- Cari entri panjang:
-
- Pada candle sinyal atau beberapa candle berikutnya.
- Sebaiknya setelah pullback kecil ke level support (lembah ayunan sebelumnya, zona permintaan, VWAP, VA low, dll.).
- Gunakan alat seperti Kalman Trend / EMA / Volume Profile untuk menyaring:
-
- Hanya ambil BELI ketika timeframe lebih tinggi atau Kalman juga bullish.
✅ Sinyal JUAL
Apa yang Anda lihat:
- Sebuah panah ke bawah
↓di atas candle - Opsional teks “JUAL”
Apa artinya:
- Struktur berubah dari bullish → bearish.
- Puncak dan lembah ayunan sekarang keduanya turun.
- Pasar kemungkinan memasuki tren turun atau melanjutkan struktur bearish.
Cara menggunakannya:
- Cari entri pendek:
-
- Pada candle sinyal atau candle berikutnya dekat resistance.
- Ideal setelah retest support yang rusak (sekarang resistance), VAH, zona suplai, dll.
🎯 Penggunaan Trading Praktis
1. Sebagai Alat Entri Mandiri
Aturan sederhana:
- Setup Beli
-
- Tunggu panah BELI.
- Pasang order long di/dekat candle sinyal.
- Stop loss di bawah lembah ayunan terbaru.
- Target puncak ayunan sebelumnya atau resistance utama.
- Setup Jual
-
- Tunggu panah JUAL.
- Pasang order short di/dekat candle sinyal.
- Stop loss di atas puncak ayunan terbaru.
- Target lembah ayunan sebelumnya atau support utama.
Ini adalah penggunaan paling dasar dan bekerja terbaik pada H1, H4, dan D1, di mana struktur lebih bersih.
2. Sebagai Alat Konfirmasi dengan Indikator Lain Anda
Di sinilah menjadi kuat.
🔹 Dengan Kalman Filter Trend
- Hanya ambil sinyal BELI ketika:
-
- Kalman Trend menanjak ke atas dan harga berada di atau di atas garis Kalman.
- Hanya ambil sinyal JUAL ketika:
-
- Kalman Trend menanjak ke bawah dan harga berada di atau di bawah garis Kalman.
Efek:
Kalman memberi Anda tren yang halus, MarketStructureOscSignals memberi Anda pergeseran struktur yang tepat. Bersama-sama mereka menyaring banyak perdagangan buruk.
🔹 Dengan Volume Profile / Support & Resistance
- BELI kuat:
-
- Panah BELI muncul dekat VA Low, lembah ayunan sebelumnya, atau liquidity sweep, dengan penolakan.
- JUAL kuat:
-
- Panah JUAL muncul dekat VA High, puncak ayunan sebelumnya, atau liquidity sweep di atas.
Di sini sinyal bukan hanya pola teknikal tetapi juga berakar pada zona likuiditas dan aliran order.
3. Untuk Scaling In / Out
Anda juga dapat menggunakan sinyal baru sebagai:
- Titik Scale-In
Tambahkan ke posisi ketika sinyal baru muncul dalam arah yang sama dengan perdagangan Anda yang ada dan timeframe lebih tinggi sejajar. - Keluar Awal / Keluar Parsial
Jika Anda long dan muncul sinyal JUAL yang berlawanan dengan posisi Anda (terutama dekat struktur kunci), Anda dapat: -
- Menutup sebagian posisi
- Atau memperketat stop
🧪 Pengaturan Awal yang Direkomendasikan
Untuk Forex H1 / H4:
Swing Left = 2Swing Right = 2Min Bars Between Signals = 3Arrow Offset = 5–10 pips
Untuk Indices M15 / H1:
Swing Left = 2–3Swing Right = 2–3Min Bars Between Signals = 5Arrow Offsetdisesuaikan dengan simbol (misal 20–50 “pips” tergantung broker)
Untuk Crypto H1 / H4:
- Ayunan sedikit lebih tinggi untuk menyaring noise:
-
Swing Left = 3Swing Right = 3Min Bars Between Signals = 4–6
Selalu lakukan backtest dengan instrumen dan timeframe pilihan Anda untuk menyempurnakan Swing dan MinBarsBetweenSignals.
Ringkasan
Ulasan pelanggan
5 | 100 % | |
4 | 0 % | |
3 | 0 % | |
2 | 0 % | |
1 | 0 % |


