
Descrição
Indicadores da loja Pinescriptlabs: cBots da loja Pinescriptlabs : (cBot) Gold & BTC BreakoutSession Pivots(novo)
Trailing Smart Algorithm(Novo)
Prediction Based on Linreg & ATR
SmartTrend Support &
Resistance
Lines
Dynamic
Market Structure
Analysis
of
Turning
Points
Fibonacci
Linear
Regression
Multi-timeframe
Multi-Level
Candle Bias
Tracker
Auto
Support and
Resistance
Trend
Lines
All
Support and
Resistance
Levels
Fear & Greed Index
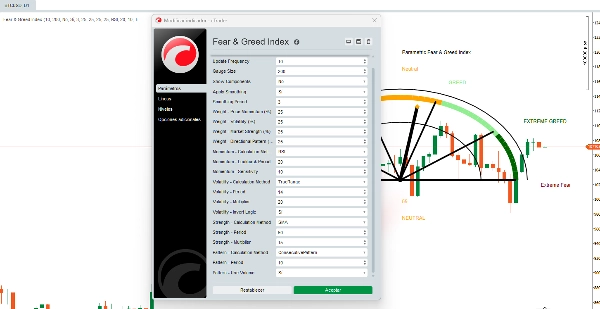
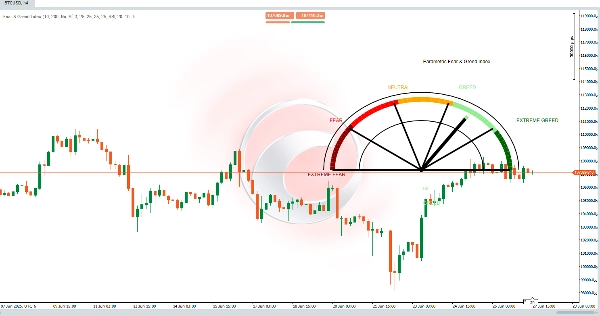
O índice Fear & Greed é um algoritmo visual avançado que sintetiza o sentimento do mercado em um valor de 0-100 usando um medidor semicircular. Diferente das versões básicas, esta ferramenta é totalmente personalizável, permitindo que os traders ajustem todos os aspectos de seu cálculo.
📊 Os 4 Componentes Principais (Configuráveis)
1️⃣ Momentum de Preço *(Peso Configurável: 0-100%)*
6 Métodos de Cálculo Disponíveis:
- PriceChange: Mudança percentual simples em relação ao período anterior
- ROC: Taxa de variação normalizada
- RSI: RSI modificado para momentum
- SMADeviation: Desvio de preço em relação à SMA
- EMADeviation: Desvio de preço em relação à EMA
- MACD: Sinal MACD como indicador de momentum
🔧 Parâmetros Personalizáveis:
- Período de retrocesso *(5-100)*
- Sensibilidade do cálculo *(1.0-50.0)*
2️⃣ Volatilidade *(Peso Configurável: 0-100%)*
6 Métodos de Cálculo Disponíveis:
- TrueRange: Volatilidade baseada no True Range
- HighLowRange: Intervalo simples High-Low
- CloseToClose: Volatilidade logarítmica close-to-close
- ATR: Average True Range padrão
- StandardDev: Desvio padrão do preço
- ParkinsonVol: Estimador de volatilidade de Parkinson
🔧 Parâmetros Personalizáveis:
- Período de cálculo *(5-50)*
- Multiplicador de volatilidade *(1.0-100.0)*
- Inversão lógica (maior volatilidade = mais medo)
3️⃣ Força do Mercado *(Peso Configurável: 0-100%)*
6 Métodos de Cálculo Disponíveis:
- SMA: Posição relativa à Média Móvel Simples
- EMA: Posição relativa à Média Móvel Exponencial
- VWAP: Posição relativa ao Preço Médio Ponderado por Volume
- HLBand: Posição dentro da faixa High-Low
- BollingerPos: Posição dentro das Bandas de Bollinger
- PivotDistance: Distância até os pontos pivô
🔧 Parâmetros Personalizáveis:
- Período de cálculo *(10-200)*
- Multiplicador de força *(1.0-50.0)*
4️⃣ Padrão Direcional *(Peso Configurável: 0-100%)*
6 Métodos de Cálculo Disponíveis:
- BullBearRatio: Razão de velas de alta/baixa
- VolumePattern: Análise da tendência de volume
- BodySizePattern: Análise do tamanho do corpo da vela
- WickPattern: Análise do padrão do pavio
- GapPattern: Detecção e análise de gaps
- ConsecutivePattern: Análise de movimentos consecutivos de preço
🔧 Parâmetros Personalizáveis:
- Período de análise *(5-30)*
- Uso de volume nos cálculos (opcional)
⚙️ Recursos Avançados
🔹 Sistema de Pesos Flexível
- Pesos personalizados por componente *(0-100%)*
- Auto-normalização se os pesos não somarem 100%
- Avisos para configurações subótimas
🔹 Suavização Inteligente
- Suavização opcional para reduzir ruído
- Período de suavização ajustável *(1-10)*
- Filtro SMA aplicado aos resultados finais
🔹 Exibição Totalmente Personalizável
- Tamanho do medidor *(50-500px)*
- Frequência de atualização *(1-50 barras)*
- Detalhamento opcional dos componentes (mostra valores individuais)
- Auto-adapta-se ao instrumento e ao timeframe
🔄 Processo do Algoritmo
Passo 4: Visualização
O medidor semicircular exibe 5 zonas de cor:
- 0-20: Medo Extremo
- 21-40: Medo
- 41-60: Neutro
- 61-80: Ganância
- 81-100: Ganância Extrema
✅ Sistema Totalmente Personalizável:
🎯 Flexibilidade Total
- Adapta-se a qualquer mercado: Forex, Cripto, Ações, Commodities
- Específico para timeframe: Configurações diferentes para scalping vs. swing trading
- Evolui com o mercado: Ajusta estratégias conforme as condições mudam
Resumo
Avaliações de clientes
5 | 100 % | |
4 | 0 % | |
3 | 0 % | |
2 | 0 % | |
1 | 0 % |


![Logótipo de "[Hamster-Coder] Moving Average MTF"](https://cdn.ctrader.com/image/webp/b11b98b1-194d-4b8e-b00e-d611826ad159_31226)


