
Deskripsi
APA YANG DILAKUKANNYA
Auto-Draw Fibonacci Suite secara otomatis mendeteksi struktur ayunan dan menggambar tujuh alat geometris secara bersamaan—empat alat Fibonacci ditambah tiga alat analisis geometris pelengkap—tanpa perlu penempatan manual.
Analisis Fibonacci tradisional berarti mengidentifikasi ayunan, menggambar retracement, menggambar ulang kipas dari ayunan yang sama, menempatkan pitchfork secara manual, menyesuaikan zona waktu. Setiap alat memerlukan pengaturan terpisah. Setiap ayunan baru berarti menggambar ulang semuanya.
Indikator ini mengotomatisasi seluruh proses tersebut.
Ayunan dideteksi sekali melalui metode regresi. Semua tujuh alat geometris—retracement Fibonacci, ekspansi, kipas, dan zona waktu, plus Andrews Pitchfork, saluran ekuidistan, dan kipas Gann—secara otomatis merujuk pada titik ayunan yang sama tersebut.
Ketika harga membuat ayunan baru, setiap alat aktif diperbarui secara real-time. Tidak perlu menggambar ulang. Tidak perlu pemilihan ayunan manual. Tidak ada inkonsistensi geometris dari penggunaan pivot berbeda di berbagai alat.
MANFAAT UTAMA
Pendekatan Manual:
- Identifikasi ayunan tinggi dan ayunan rendah secara visual
- Gambar retracement Fibonacci
- Identifikasi ayunan yang sama lagi, gambar kipas
- Temukan tiga ayunan, tempatkan pitchfork secara manual
- Harga membuat ayunan baru → ulangi seluruh proses
Pendekatan Auto-Draw:
- Indikator mendeteksi ayunan secara otomatis
- Semua tujuh alat menggambar dan memperbarui dirinya sendiri
- Harga membuat ayunan baru → semuanya diperbarui secara otomatis
- Perbedaannya adalah struktural. Alih-alih tujuh alur kerja manual terpisah, Anda memiliki satu sistem deteksi otomatis yang memproyeksikan ke semua domain geometris—alat berbasis Fibonacci untuk analisis rasio dan tiga kerangka geometris tambahan untuk pemetaan struktur pasar yang komprehensif.
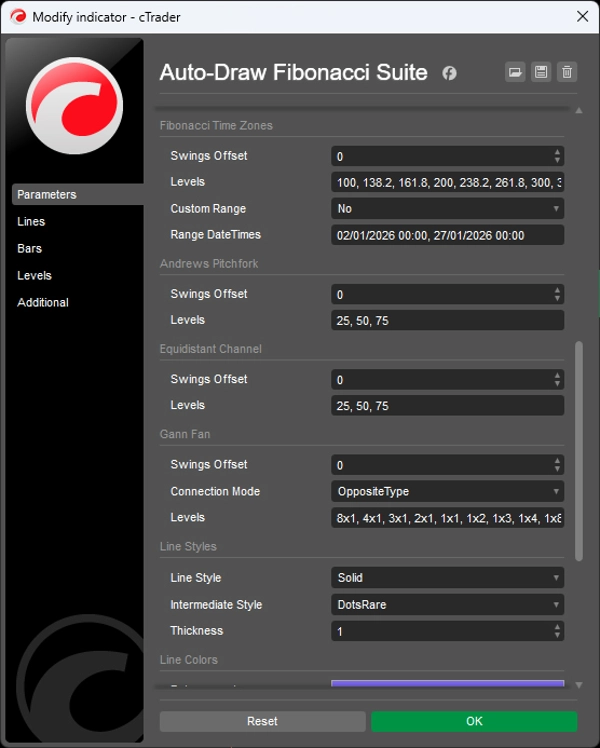
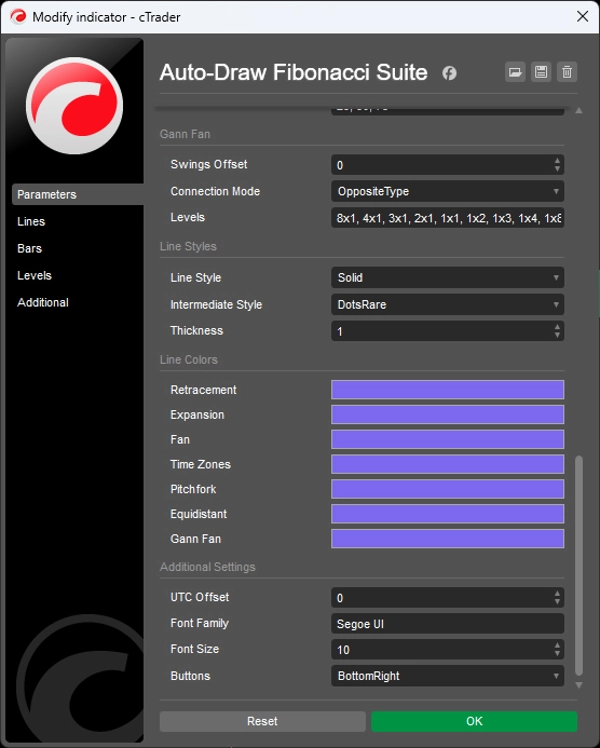
PAKET ALAT
Empat Alat Fibonacci:
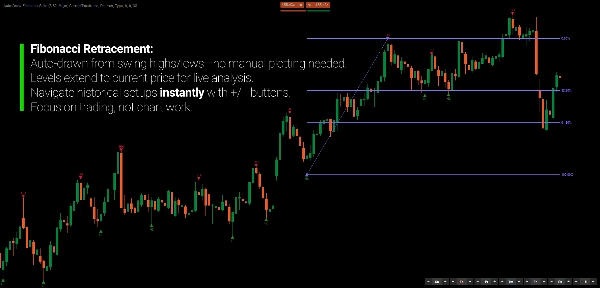
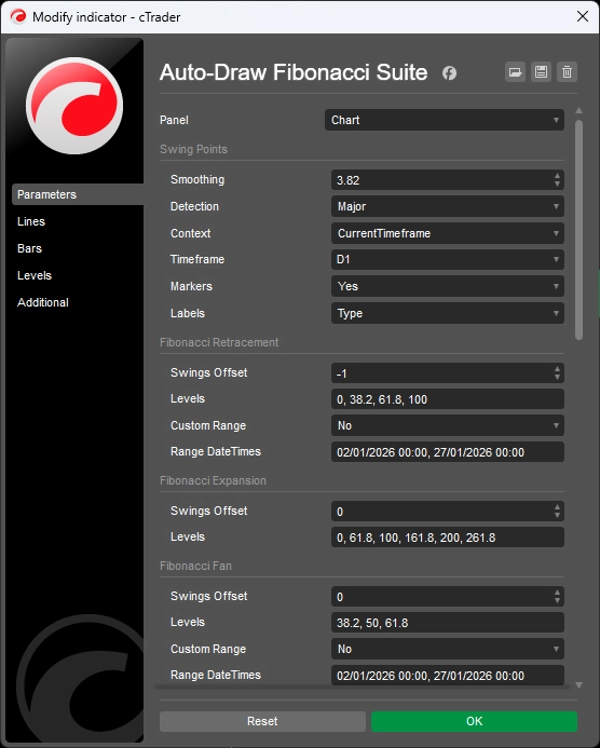
- Retracement Fibonacci — level horizontal (0%, 38.2%, 61.8%, 100%)
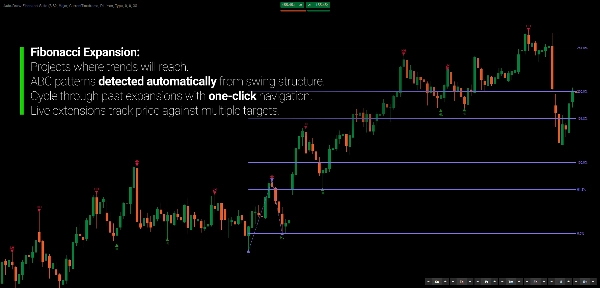
- Ekspansi Fibonacci — target proyeksi di luar ayunan ketiga
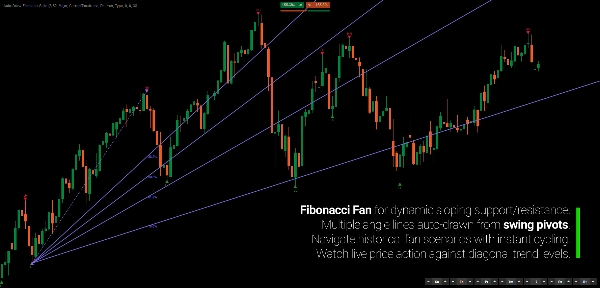
- Kipas Fibonacci — garis tren diagonal dari titik pivot
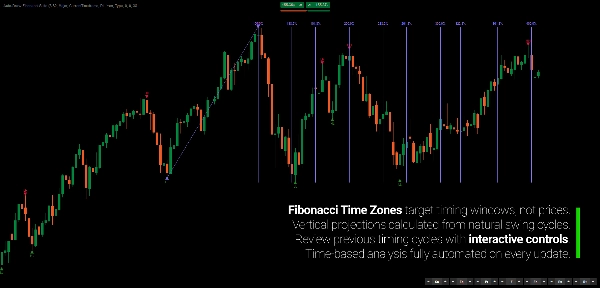
- Zona Waktu Fibonacci — proyeksi waktu vertikal
Tiga Alat Geometris Pelengkap:
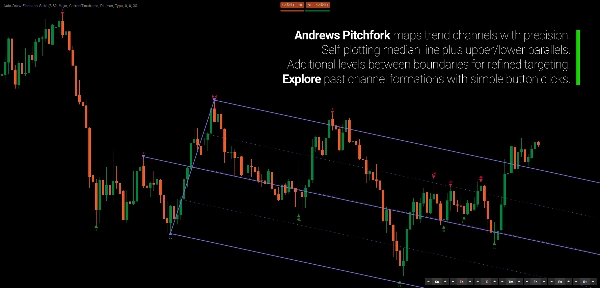
- Andrews Pitchfork — median tiga titik dengan saluran paralel
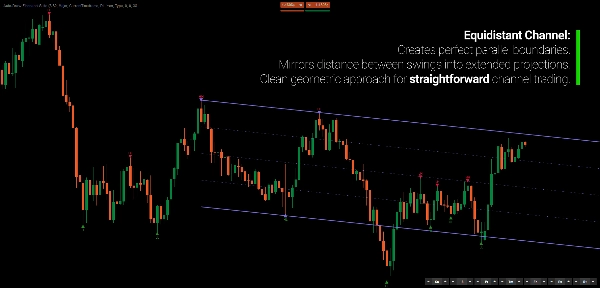
- Saluran Ekuidistan — saluran paralel dengan level menengah
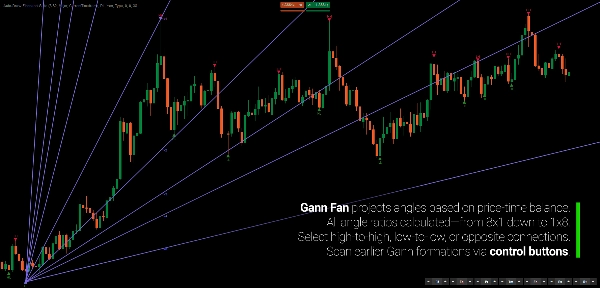
- Kipas Gann — proyeksi sudut harga-ke-waktu (8x1, 4x1, 2x1, 1x1, 1x2…)
Setiap alat dapat diaktifkan secara independen. Semua merujuk pada deteksi ayunan dasar yang sama.
DETEKSI AYUNAN TERPADU
Tiga mode deteksi mengontrol sensitivitas ayunan:
- Mayor — ayunan lebih sedikit, lebih kuat (dikonfirmasi oleh penutupan)
- Standar — granularitas seimbang (paling umum)
- Minor — mendeteksi ayunan dalam tren (detail maksimum)
Ayunan diklasifikasikan secara otomatis (HH/LL/LH/HL) dan diukur berdasarkan kedalaman, volume, dan durasi. Penanda visual menunjukkan ayunan yang dikonfirmasi (segitiga), ayunan yang tidak dikonfirmasi (lingkaran), dan ayunan dalam (persegi).
KONTROL OFFSET INTERAKTIF
Tujuh grup tombol (satu per alat) memungkinkan Anda langsung menyesuaikan ayunan historis mana yang digunakan setiap proyeksi geometris:
- 0 — struktur ayunan terbaru
- -1 — struktur sebelumnya
- -2 — dua struktur ke belakang
Jelajahi sejarah ayunan ke belakang untuk melihat bagaimana hubungan geometris berkembang pada titik struktural sebelumnya. Ubah ayunan referensi alat mana pun tanpa memengaruhi yang lain.
DUKUNGAN MULTI-TIMEFRAME
Terapkan deteksi ayunan pada timeframe lebih tinggi sambil melihat grafik timeframe lebih rendah. Lihat ayunan Harian dan semua proyeksi geometris di grafik H1 Anda—tanpa perlu beralih timeframe.
FITUR UTAMA
- Deteksi ayunan otomatis melalui metodologi regresi
- Tujuh alat geometris digambar otomatis dari referensi ayunan terpadu
- Pembaruan real-time saat ayunan baru terbentuk
- Kontrol offset interaktif untuk setiap alat
- Mode multi-timeframe (analisis Harian, trading H1)
- Tiga mode deteksi (Mayor/Standar/Minor)
- Klasifikasi ayunan (HH/LL/LH/HL) dan metrik
- Pengelompokan ayunan cerdas (menghilangkan ayunan menengah yang berlebihan)
- Level, warna, gaya yang sepenuhnya dapat disesuaikan
- Ayunan sumber yang disorot untuk alat aktif
UNTUK SIAPA INI
Indikator ini untuk trader yang memahami alat analisis Fibonacci dan geometris tetapi tidak ingin menghabiskan waktu menempatkan dan menggambar ulang secara manual.
Jika Anda menggunakan beberapa proyeksi Fibonacci dan terus menggambar ulang saat harga berkembang—atau menghindari alat tertentu karena penempatan manual terlalu melelahkan—paket ini mengotomatisasi alur kerja tersebut.
Ini sangat cocok untuk trader ayunan dan posisi yang membutuhkan referensi geometris di berbagai alat, analis multi-timeframe yang menginginkan struktur timeframe lebih tinggi pada grafik eksekusi, dan trader diskresioner yang menghargai konfluensi geometris tetapi tidak ingin kerepotan mengelola alat secara manual.
Ini bukan sistem sinyal. Ini adalah alat otomatisasi untuk trader yang sudah berpikir dalam istilah Fibonacci dan geometris dan ingin analisis mereka diperbarui secara otomatis.
APA YANG MEMBUATNYA BERBEDA
Sebagian besar indikator analisis geometris menggambar satu jenis alat. Paket ini menggambar tujuh secara bersamaan dari deteksi ayunan terpadu.
Sebagian besar memerlukan pemilihan ayunan manual. Ini mengotomatisasi identifikasi ayunan dan memperbarui semua alat secara real-time.
Sebagian besar memperlakukan setiap alat secara independen. Ini menjaga koherensi geometris dengan memastikan semua proyeksi merujuk pada struktur dasar yang sama.
Hasilnya: analisis geometris multi-kerangka lengkap tanpa perlu menggambar ulang terus-menerus.
---
MEMAHAMI FIBONACCI SEBAGAI BAHASA GEOMETRIS
Analisis Fibonacci sering disalahpahami sebagai prediktif—seolah pasar "menghormati" rasio tertentu. Ini melewatkan prinsip dasar.
Rasio Fibonacci tidak memprediksi kemana harga akan bergerak. Mereka menyediakan kosakata geometris standar untuk menggambarkan bagaimana harga bergerak sehubungan dengan struktur sebelumnya. Retracement ke 61,8% mewakili hubungan geometris antara koreksi saat ini dan impuls sebelumnya—bukan "dukungan" dalam arti kausal.
Nilainya terletak pada koherensi geometris, bukan level individu. Ketika beberapa proyeksi bertemu—level retracement sejajar dengan sudut kipas dan zona waktu—konvergensi itu mencerminkan konsistensi struktural di berbagai domain pengukuran.
Pasar tidak menargetkan level Fibonacci. Ketika proyeksi geometris sejajar, keselarasan itu mengungkapkan keteraturan struktural dasar. Inilah sebabnya level terisolasi memiliki nilai terbatas sementara struktur geometris konvergen sering menandai titik belok.
Geometri bukan penyebabnya. Ini adalah bahasa deskriptif dari hubungan struktural.
---
Trading melibatkan risiko. Indikator ini adalah alat analisis teknikal—selalu terapkan manajemen risiko yang tepat.


