
O QUE ELE FAZ
Structural Supertrend resolve uma limitação fundamental do Supertrend clássico: ele inverte a direção no momento em que o preço fecha além da sua banda.
Em tendências limpas, isso funciona bem. Em condições voláteis ou instáveis, uma única vela agressiva pode disparar uma inversão — mesmo quando a tendência mais ampla permanece estruturalmente intacta. O resultado são oscilações, saídas prematuras e reentradas a preços piores.
Este indicador é construído com base em uma premissa diferente.
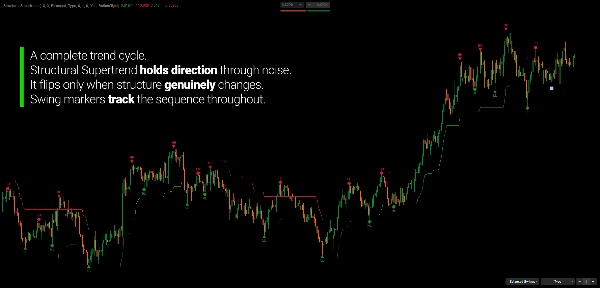
As mudanças de direção ocorrem somente quando o preço confirma uma mudança estrutural genuína — não apenas um fechamento momentâneo além de um limite. O resultado são menos reversões falsas e melhor alinhamento com o desenvolvimento real das tendências.
O Supertrend torna-se estrutural. Os sinais tornam-se significativos.
POR QUE STRUCTURAL SUPERTREND?
O Problema
O Supertrend original trata todo fechamento além da sua banda como uma reversão. Isso é intencional — torna o indicador reativo por design. Mas a reatividade tem um custo.
Durante fases de consolidação, o preço frequentemente fecha além de uma banda e logo reverte. Cada um desses gera um sinal de inversão, cada inversão representa uma decisão potencial de negociação, e cada uma representa uma saída de uma posição que não precisava ser encerrada.
Traders que usam o Supertrend há tempo suficiente conhecem bem essa frustração.
A Solução
Structural Supertrend estende o modelo original para distinguir entre fechamentos impulsionados pela volatilidade e mudanças direcionais genuínas. Ele filtra o ruído exigindo confirmação estrutural antes de mudar a direção da tendência.
Menos inversões. Melhor alinhamento da tendência. Menos reativo a velas individuais.
Por que manter ambos?
O Supertrend original ainda aparece no gráfico — mas somente onde difere do Structural. Esse design é intencional.
- Structural acompanha a direção da tendência principal
- Original revela o comportamento impulsivo e corretivo dentro dessa tendência
Quando ambos concordam: convicção direcional forte. Quando divergem: o movimento provavelmente é corretivo, não uma reversão verdadeira. Essa visão em duas camadas oferece contexto que nenhuma das linhas fornece sozinha.
DETECÇÃO DE SWING INTEGRADA
Structural Supertrend inclui uma detecção completa de swings e uma estrutura de S/R — não como um recurso secundário, mas como uma extensão direta da análise estrutural.
Os swings são identificados através de um processo de qualificação que prioriza a estrutura: cada candidato é avaliado quanto a deslocamento, confirmação de volume e distância relativa ao ATR antes de ser aceito. Isso mantém o mapa de swings focado em pontos de virada significativos, e não em cada extremo local.
Três Modos de Detecção
- Menor — sensibilidade aumentada, captura swings internos dentro das tendências
- Balanceado — granularidade filtrada, melhor para a maioria dos casos de uso
- Maior — apenas os pivôs estruturais mais fortes, confirmados por critérios mais amplos
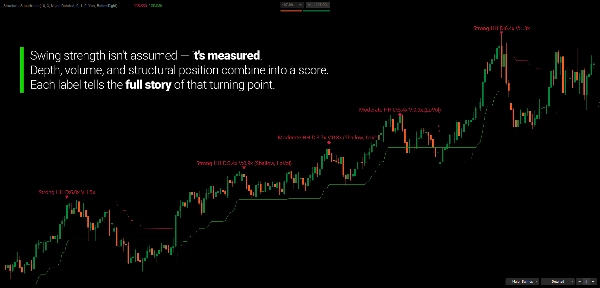
Classificação da Força do Swing
Cada swing confirmado é pontuado por profundidade, volume e posição estrutural relativa ao swing anterior do mesmo tipo. A força é classificada dinamicamente usando ranking percentil ao longo do histórico recente de swings — não por limites fixos. Marcadores visuais refletem a classificação: triângulos para forte, diamantes para moderado, círculos para fraco.
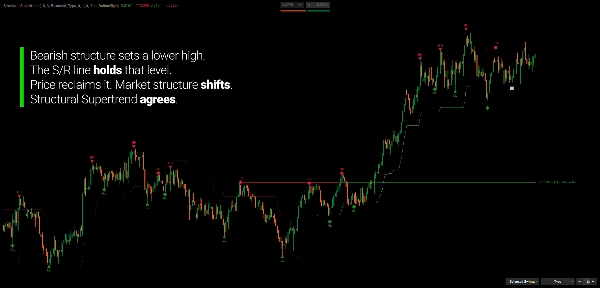
Zonas de S/R com Rastreamento de Polaridade
Swings confirmados tornam-se níveis ativos de S/R que acompanham seu próprio histórico de interação. Quando o preço revisita um nível, o indicador registra se o contato foi uma rejeição pelo pavio ou uma quebra pelo corpo. Quando um nível é varrido e fecha além dele, a polaridade inverte — a resistência anterior torna-se suporte, e vice-versa. Se varrido novamente, a zona é invalidada.
Etiquetas de idade mostram há quanto tempo cada nível está ativo e quantas vezes foi testado.
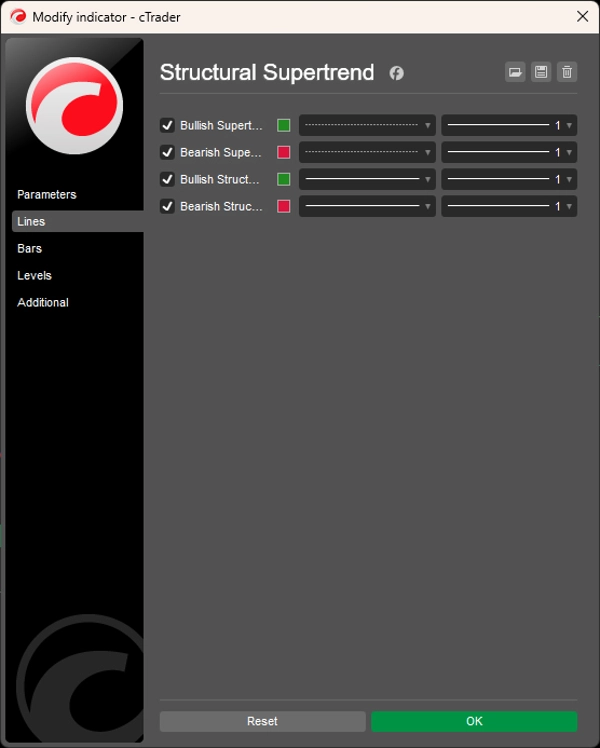
LENDO O GRÁFICO
- Linha de Estrutura Verde: Tendência estrutural de alta (suporte dinâmico)
- Linha de Estrutura Vermelha: Tendência estrutural de baixa (resistência dinâmica)
- Linha Pontilhada: Supertrend original — visível apenas onde difere do Structural
- Linhas de S/R: Níveis ativos com estado de polaridade e idade
Verificação de Alinhamento de Tendência:
- Estrutura + Original concordam → Movimento direcional de alta convicção
- Estrutura + Original divergem → Provável fase corretiva ou de transição
PARA QUEM É
Este indicador é para traders que querem ler a direção da tendência e a estrutura do mercado a partir de um único framework coerente.
Se você usou o Supertrend clássico e achou-o muito reativo — invertendo frequentemente durante condições laterais — o Structural Supertrend foi criado para resolver exatamente isso.
É bem adequado para traders de tendência e swing que querem uma leitura direcional mais limpa sem reversões falsas constantes, traders baseados em estrutura que acompanham sequências de swings para validar a saúde da tendência, e traders discricionários que usam níveis de S/R como contexto para entradas, saídas e gestão de posições.
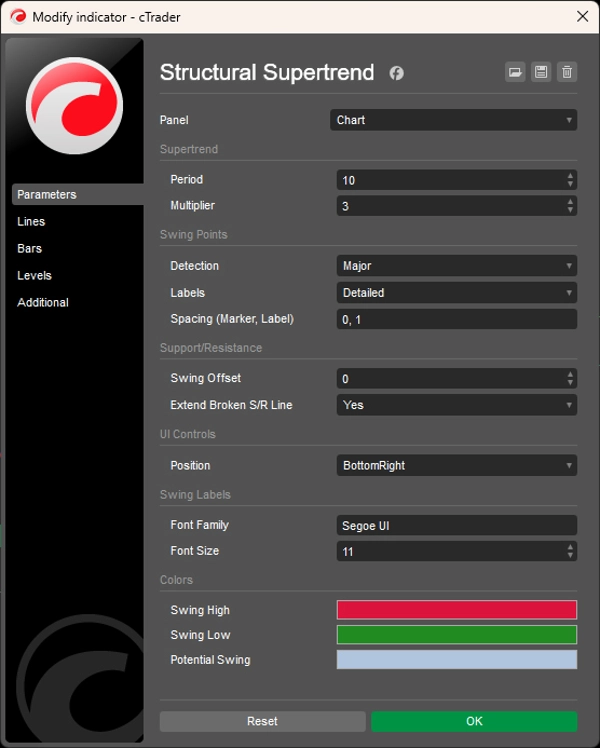
Os controles de interface integrados tornam-no prático para uso em tempo real: alterne modos de detecção, ajuste referências de S/R e alterne o detalhe das etiquetas diretamente no gráfico — sem necessidade de abrir o painel de configurações.
Este não é um gerador de sinais. É um framework de análise estrutural para traders que querem entender onde o mercado está, não apenas o que ele está fazendo agora.
O QUE O DIFERENCIA
A maioria das implementações do Supertrend trata todo fechamento além de uma banda como acionável. Este trata como um candidato — e exige evidência estrutural antes de se comprometer com uma mudança de direção.
A maioria dos detectores de swing identifica máximas e mínimas locais sem critérios de avaliação. Este qualifica cada swing por deslocamento, volume e posição estrutural — e pontua a força dinamicamente contra o histórico recente de swings.
A maioria das ferramentas de S/R desenha uma linha e a deixa. Esta acompanha o histórico de interação, sinaliza mudanças de polaridade e continua evoluindo conforme o mercado revisita cada nível.
O resultado: uma ferramenta de tendência e estrutura que permanece relevante por mais tempo, reage menos ao ruído e constrói uma imagem mais rica da condição do mercado ao longo do tempo.
---
ENTENDENDO A ANÁLISE ESTRUTURAL
A estrutura do mercado não é sobre encontrar o "swing certo" ou a "direção correta" da tendência. É sobre manter uma imagem objetiva de como as sequências de preço estão se desenvolvendo — e se essa sequência permanece coerente ou está começando a se degradar.
Uma tendência é definida não por um único movimento, mas por uma série de relações: máximas e mínimas mais altas em tendências de alta, máximas e mínimas mais baixas em tendências de baixa. Cada novo swing confirma ou desafia a sequência existente. Quando a confirmação continua, a estrutura está intacta. Quando ela quebra, a estrutura está em transição.
O que torna a análise estrutural útil não é que ela prevê para onde o preço irá, mas que ela descreve onde o preço está atualmente dentro de sua própria sequência. Essa distinção é importante. Previsão requer suposições sobre o futuro. Observação estrutural requer apenas uma leitura precisa do que já aconteceu.
Indicadores baseados na lógica estrutural são projetados para apoiar essa observação — para tornar a sequência visível e rastreável sem introduzir interpretação subjetiva. O objetivo é clareza sobre a condição atual do mercado, não certeza sobre a direção futura do preço.
---
Negociar envolve risco. Este indicador é uma ferramenta de análise técnica — sempre aplique uma gestão de risco adequada.
5 | 67 % | |
4 | 33 % | |
3 | 0 % | |
2 | 0 % | |
1 | 0 % |


