
Deskripsi
Indikator Jejak Profesional & Delta untuk cTrader
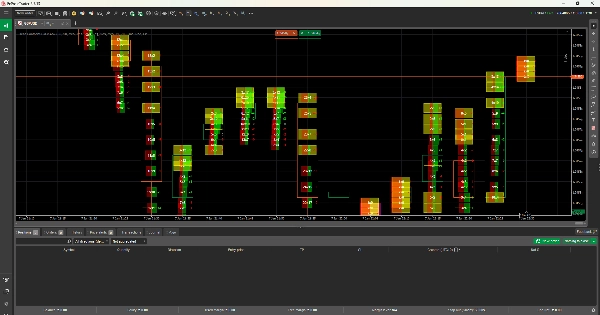
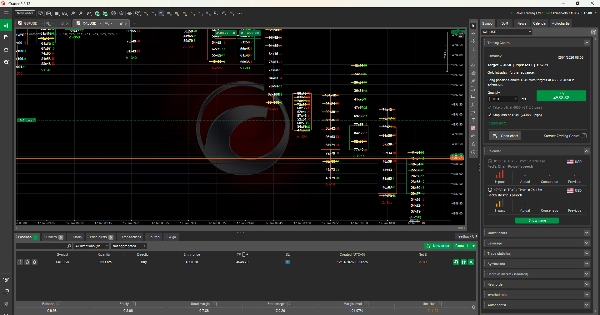
Indikator Jejak ini untuk cTrader membaca data tick nyata untuk menunjukkan bagaimana pembeli dan penjual berinteraksi di setiap level harga. Ini menampilkan volume, delta bid/ask, dan ketidakseimbangan, membantu trader melihat dengan jelas siapa yang mengendalikan pasar.
Dibangun menggunakan konsep Market Profile dan Volume Profile, indikator ini menyoroti area aktivitas tinggi, zona nilai, dan dukungan atau resistensi yang kuat. Alih-alih menebak hanya dari harga, trader dapat membuat keputusan berdasarkan volume perdagangan nyata dan aliran order.
Sangat cocok untuk scalping dan trading intraday, alat ini memberikan pengguna cTrader keunggulan profesional dengan mengungkap cerita sebenarnya di balik pergerakan harga.
Indikator ini membantu Anda memahami apa yang sebenarnya terjadi di dalam setiap candle. Ini membaca data tick dan menunjukkan berapa banyak pembeli dan penjual yang berdagang di setiap harga.
Anda dapat melihat dengan jelas:
- Di mana pembeli lebih kuat
- Di mana penjual lebih kuat
- Kapan momentum meningkat atau melambat
Indikator ini juga menunjukkan delta, yang berarti perbedaan antara tekanan beli dan jual. Ini dibangun menggunakan Market Profile dan Volume Profile, sehingga Anda dapat dengan mudah menemukan area harga penting di mana pasar bereaksi.
Ini membuat trading lebih mudah bagi pemula karena Anda tidak perlu menebak. Anda dapat melihat volume nyata dan aktivitas pasar nyata, bukan hanya indikator berdasarkan harga.


![Logo "[Stellar Strategies] Smart ADX"](https://cdn.ctrader.com/image/webp/af13b084-b6f6-41db-b7bc-c7e688b57b05_36929)


