
Deskripsi
VOLUME HEATMAP PRO - Visualisasi Kepadatan Pasar Profesional
Lihat pasar seperti belum pernah sebelumnya dengan heatmap volume canggih ini yang mengubah data volume kompleks menjadi tampilan visual yang intuitif. Berbeda dengan indikator volume tradisional yang hanya menampilkan batang di bagian bawah grafik Anda, Volume Heatmap Pro mengungkapkan dengan tepat di mana para trader institusional mengakumulasi dan mendistribusikan posisi di setiap tingkat harga.
FITUR UTAMA:
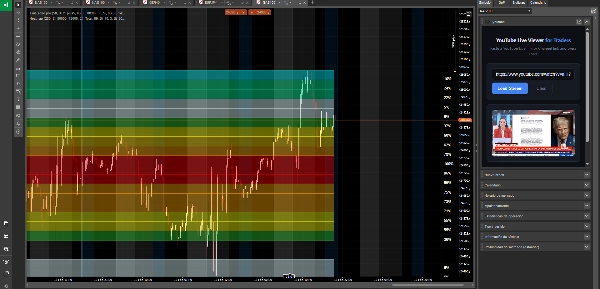
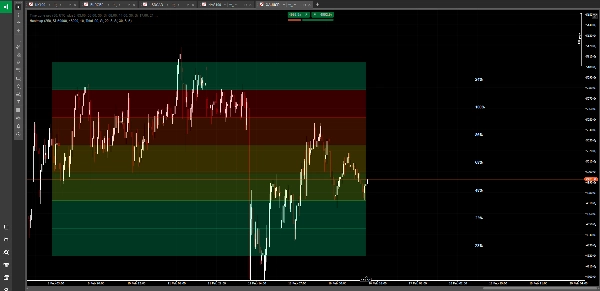
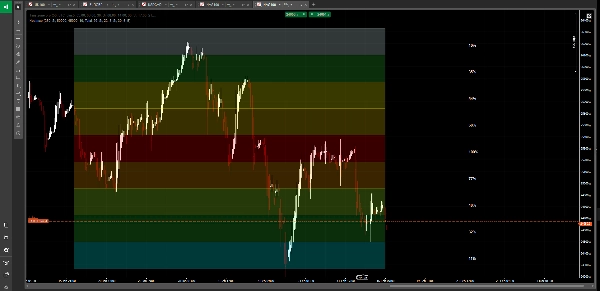
🔥 Heatmap Berkode Warna Dinamis
Rasakan analisis volume melalui sistem gradasi warna 10 tingkat yang menakjubkan. Dari biru es (aktivitas minimal) hingga merah menyala (volume maksimum), segera identifikasi di mana aliran uang besar terjadi. Heatmap diperbarui secara real-time, menunjukkan kepadatan pasar secara sekilas.
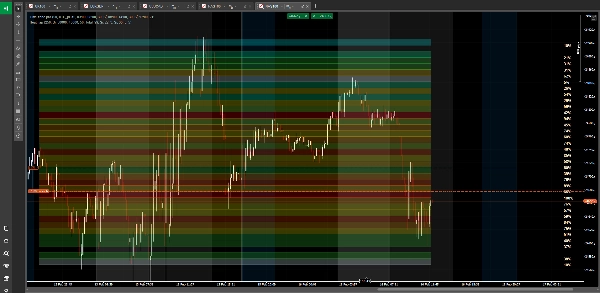
📍 Deteksi Titik Kontrol (POC)
Secara otomatis mengidentifikasi dan menyoroti tingkat harga dengan volume perdagangan tertinggi - titik keseimbangan pasar yang sebenarnya. Di sinilah institusi membangun posisi terbesar mereka dan di mana harga cenderung kembali.
🎯 Distribusi Volume Multi-Level
Membagi rentang harga Anda menjadi hingga 50 tingkat presisi, menciptakan peta rinci distribusi volume. Lihat dengan tepat harga mana yang menarik perdagangan berat dan mana yang diabaikan oleh pasar.
📊 Tiga Mode Analisis Volume
• Total Volume - Lihat semua aktivitas pasar
• Buy Volume Only - Isolasi zona tekanan bullish
• Sell Volume Only - Identifikasi area distribusi bearish
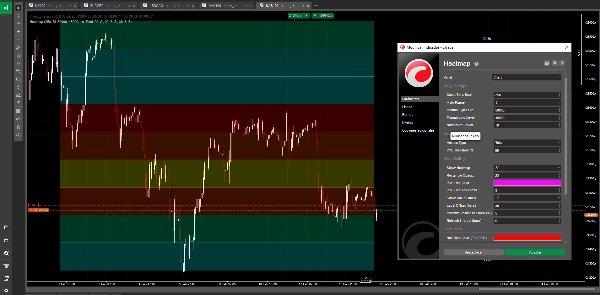
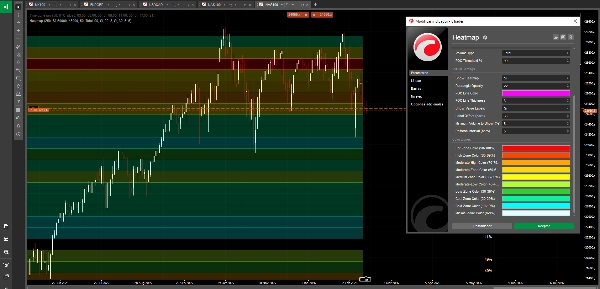
🎨 Visualisasi Profesional
• Persegi panjang berkode warna yang mencakup periode analisis Anda
• Opasitas yang dapat disesuaikan untuk integrasi grafik yang sempurna
• Label persentase volume opsional pada setiap tingkat
• Garis POC yang dapat disesuaikan dengan kontrol ketebalan
• Tampilan bersih dan tidak mengganggu
⚙️ Teknologi Auto-Range Cerdas
Secara otomatis menghitung rentang harga optimal dari periode lookback Anda, atau tentukan rentang Anda sendiri secara manual untuk analisis spesifik. Heatmap menyesuaikan dengan kondisi pasar atau kerangka waktu apa pun.
🔄 Kinerja Dioptimalkan
Interval penyegaran yang dapat dikonfigurasi memastikan kinerja grafik yang mulus sambil mempertahankan analisis volume yang akurat. Analisis hingga 500 batang ke belakang tanpa lag.
📈 Zona Warna yang Dapat Disesuaikan
Personalisasi semua 10 zona warna untuk menyesuaikan preferensi visual Anda:
• Zona Panas (90-100%) - Konsentrasi volume maksimum
• Zona Tinggi (80-89%) - Aktivitas kuat
• Sedang-Tinggi (70-79%) - Volume di atas rata-rata
• Sedang (60-69%) - Aktivitas solid
• Medium (50-59%) - Volume rata-rata
• Sedang-Rendah (40-49%) - Di bawah rata-rata
• Zona Rendah (30-39%) - Aktivitas ringan
• Zona Dingin (20-29%) - Perdagangan minimal
• Zona Sangat Dingin (10-19%) - Volume sangat ringan
• Minimal (0-9%) - Hampir tidak ada aktivitas
COCOK UNTUK:
• Mengidentifikasi zona akumulasi dan distribusi institusional
• Menemukan node volume rendah untuk area potensi breakout
• Menemukan level support dan resistance volume tinggi
• Memahami struktur pasar dan likuiditas
• Mengonfirmasi entri perdagangan di area volume tinggi
• Menghindari zona jebakan likuiditas rendah
• Analisis profil volume multi-timeframe
APA YANG MEMBUATNYA BERBEDA:
Indikator volume tradisional menunjukkan seberapa BANYAK yang diperdagangkan, tetapi tidak DI MANA. Volume Heatmap Pro mengungkapkan gambaran lengkap - peta kepadatan visual yang menunjukkan dengan tepat tingkat harga mana yang menyerap aktivitas perdagangan terbanyak. Sistem warna gradasi membuat analisis volume yang kompleks menjadi sesederhana membaca peta cuaca. Merah berarti panas (volume berat), biru berarti dingin (volume ringan).
Apakah Anda melakukan scalping pembalikan intraday atau memposisikan untuk perdagangan swing, heatmap ini menunjukkan di mana pasar memiliki keyakinan sejati dibandingkan di mana hanya kebisingan.
---
⚠️ PENAFIAN RISIKO:
Perdagangan valuta asing, cryptocurrency, dan instrumen keuangan lainnya membawa tingkat risiko tinggi dan mungkin tidak cocok untuk semua investor. Tingkat leverage yang tinggi dapat bekerja melawan Anda maupun untuk Anda. Sebelum memutuskan untuk berdagang, Anda harus mempertimbangkan dengan cermat tujuan investasi, tingkat pengalaman, dan toleransi risiko Anda. Ada kemungkinan Anda mengalami kerugian sebagian atau seluruh investasi Anda. Oleh karena itu, Anda tidak boleh menginvestasikan uang yang tidak mampu Anda kehilangan. Anda harus menyadari semua risiko yang terkait dengan perdagangan dan mencari nasihat dari penasihat keuangan independen jika Anda memiliki keraguan. Kinerja masa lalu tidak menunjukkan hasil di masa depan.
Ringkasan
Key features include automatic Point of Control (POC) detection, highlighting the price level with the highest trading volume, and multi-level volume distribution dividing the price range into up to 50 levels for detailed analysis. It supports three volume modes: total volume, buy volume only, and sell volume only, enabling users to isolate bullish or bearish pressure zones.
The indicator offers professional visualization with adjustable opacity, customizable color zones, optional volume percentage labels, and a customizable POC line. Smart auto-range technology calculates optimal price ranges based on the lookback period or manual input. Performance is optimized for smooth updates and analysis of up to 500 bars without lag.
Heatmap is suitable for identifying institutional accumulation and distribution zones, spotting support and resistance levels, understanding market structure, and conducting multi-timeframe volume profile analysis across markets including Forex, indices, and XAUUSD (gold).
Ulasan pelanggan
5 | 67 % | |
4 | 33 % | |
3 | 0 % | |
2 | 0 % | |
1 | 0 % |


