
Deskripsi
Penanda HiLo: Ungkap Titik Balik Pasar Utama
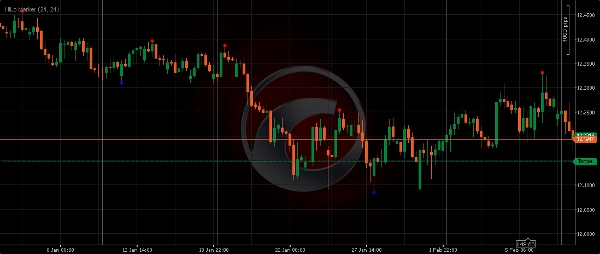
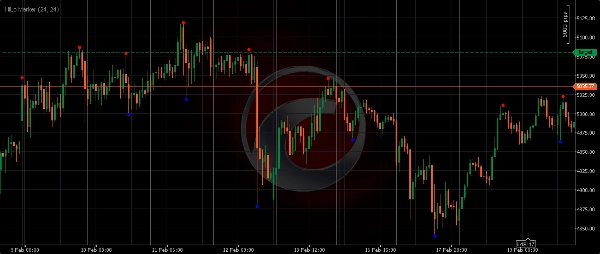
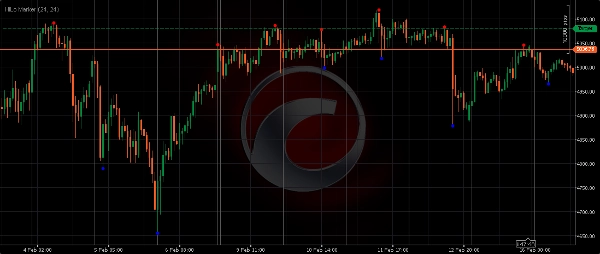
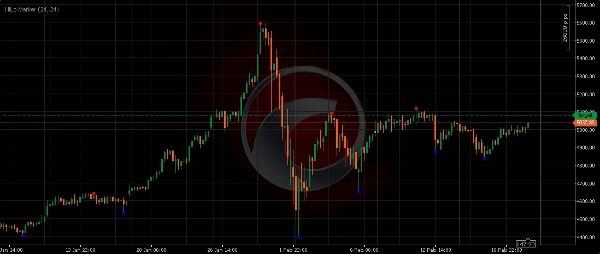
Penanda HiLo adalah indikator cTrader yang intuitif dan penting yang dirancang untuk secara otomatis mendeteksi dan menyoroti Harga Tertinggi dan Terendah yang signifikan berdasarkan jendela historis yang ditentukan. Alat ini memberikan kejelasan pada grafik Anda dengan menghilangkan tebakan dalam mengidentifikasi titik ayunan, menawarkan keunggulan visual bagi setiap trader aksi harga.
Cara Kerjanya
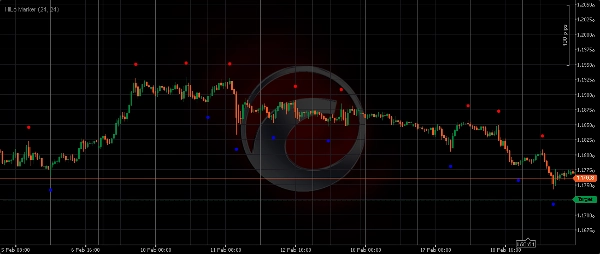
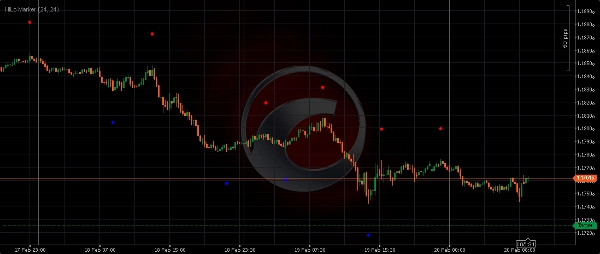
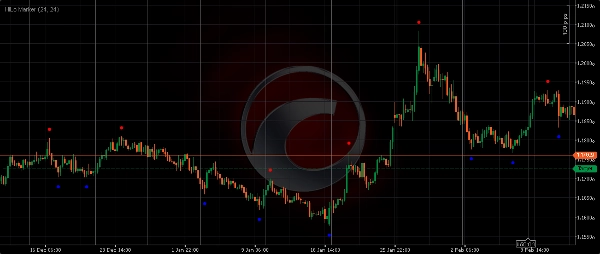
Indikator memindai "Jendela Jarak" (jumlah bar) yang ditentukan untuk menemukan Harga Tertinggi absolut dan Harga Terendah terendah dalam rentang tersebut. Setelah sebuah bar dikonfirmasi sebagai puncak atau lembah dari jendela sekitarnya, Penanda HiLo menempatkan titik merah atau biru yang khas (atau panah) di atas/bawah candle tersebut. Metode ini membantu Anda secara objektif menentukan level penting di mana harga sebelumnya berbalik atau menemukan momentum kuat.
Fitur & Manfaat Utama
- Presisi Otomatis: Tidak perlu lagi menggambar garis secara manual. Penanda HiLo secara objektif mengidentifikasi titik balik penting.
- Struktur Pasar yang Jelas: Visualisasikan ayunan, tren, dan rentang secara instan, membuat analisis grafik lebih efisien.
- Zona Dukungan & Resistensi: Harga tertinggi dan terendah yang ditandai sering bertindak sebagai dukungan dan resistensi di masa depan, menawarkan titik masuk/keluar dengan probabilitas tinggi.
- Serbaguna: Berfungsi dengan sempurna di semua instrumen keuangan (Forex, Emas, Indeks, Kripto, Saham) dan pada semua kerangka waktu.
- Visual yang Dapat Disesuaikan: Sesuaikan warna penanda dan jarak offset untuk integrasi grafik yang sempurna.
Penjelasan Parameter Masukan:
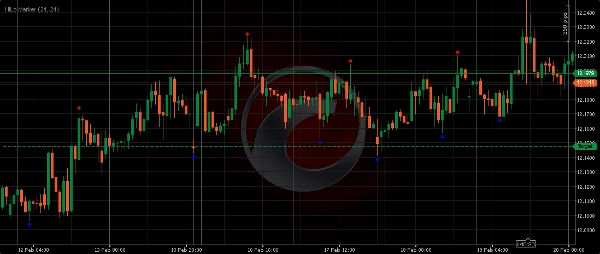
- Panjang (Offset): Nilai ini menentukan seberapa jauh di atas Harga Tertinggi atau di bawah Harga Terendah penanda akan dipasang. Nilai yang lebih besar menciptakan pemisahan visual yang lebih jelas dari candle.
-
- Contoh:
Panjang = 24berarti penanda akan muncul 24 pips (atau ticks, tergantung simbol) dari Harga Tertinggi/Terendah sebenarnya.
- Contoh:
- Jendela Jarak: Ini adalah periode mundur yang digunakan indikator untuk mengidentifikasi Harga Tertinggi atau Terendah. Sebuah bar hanya ditandai sebagai Hi/Lo jika merupakan yang tertinggi/terendah absolut dalam jumlah bar sekitarnya yang ditentukan ini.
-
- Jarak
lebih kecil(misalnya, 10-20): Menangkap ayunan kecil dan noise pasar jangka pendek (cocok untuk scalping). - Jarak
lebih besar(misalnya, 30-60+): Mengidentifikasi ayunan yang lebih signifikan pada tingkat institusional dan pembalikan tren utama (ideal untuk swing trading atau kerangka waktu lebih tinggi).
- Jarak
Tingkatkan trading aksi harga Anda dengan Penanda HiLo. Dapatkan perspektif yang lebih jelas tentang dinamika pasar dan buat keputusan yang lebih tepat. Unduh sekarang!
Ringkasan
Ulasan pelanggan
5 | 0 % | |
4 | 100 % | |
3 | 0 % | |
2 | 0 % | |
1 | 0 % |


