
Deskripsi
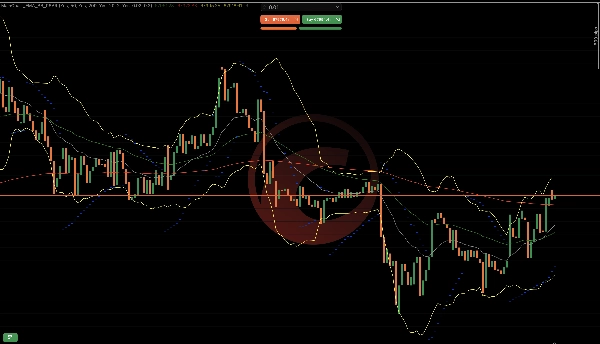
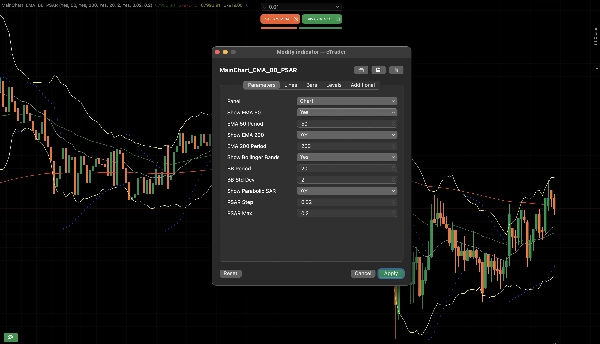
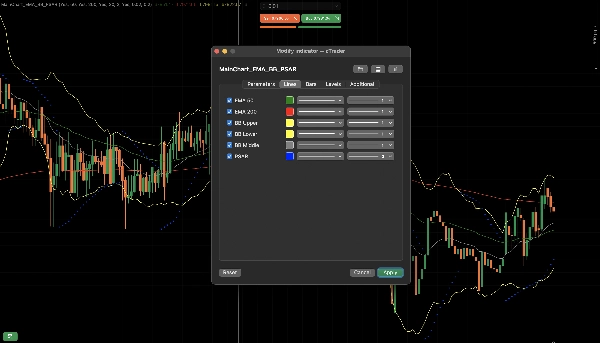
MainChart_EMA_BB_PSAR
Cara Kerjanya
1. Konsep Inti
Indikator ini menggabungkan logika tren, volatilitas, dan kelanjutan momentum menjadi satu overlay:
EMA 50 & EMA 200 → Arah tren
Bollinger Bands → Volatilitas & ekspansi
Parabolic SAR → Kelanjutan tren & waktu pembalikan
Setiap komponen memiliki fungsi spesifik. Bersama-sama, mereka membentuk kerangka keputusan yang terstruktur.
2. Logika EMA (Mesin Tren)
Apa yang Dilakukan
Menghitung rata-rata eksponensial dari harga penutupan.
EMA 50 bereaksi lebih cepat.
EMA 200 bereaksi lebih lambat.
Bagaimana Menafsirkan Pasar
Kondisi Arti
EMA 50 di atas EMA 200 Tren bullish
EMA 50 di bawah EMA 200 Tren bearish
EMA 50 melintasi EMA 200 Kemungkinan pergeseran tren
Mengapa Ini Bekerja
EMA meratakan harga dan menyaring noise.
Hubungan 50/200 menunjukkan momentum jangka pendek relatif terhadap arah jangka panjang.
3. Logika Bollinger Bands (Mesin Volatilitas)
Apa yang Dilakukan
Menghitung rata-rata bergerak (pita tengah)
Membangun pita atas/bawah menggunakan deviasi standar
Bagaimana Menafsirkan Pasar
Kondisi Arti
Pita menyempit Volatilitas rendah (kompresi)
Pita melebar Volatilitas tinggi (pergerakan kuat aktif)
Harga menyentuh pita luar Potensi overekstensi
Mengapa Ini Bekerja
Pasar berputar antara kompresi dan ekspansi.
Breakout sering terjadi setelah kontraksi volatilitas.
4. Logika Parabolic SAR (Mesin Kelanjutan)
Apa yang Dilakukan
Menampilkan titik di atas atau di bawah harga.
Mempercepat saat tren berlanjut.
Bagaimana Menafsirkan Pasar
Posisi Titik Arti
Di bawah harga Tren naik aktif
Di atas harga Tren turun aktif
Titik berbalik Kemungkinan pembalikan
Mengapa Ini Bekerja
PSAR mengencang saat tren matang, membantu melacak pergerakan dan mendeteksi kelelahan.
5. Bagaimana Semua Komponen Bekerja Bersama
Struktur Bullish
EMA 50 di atas EMA 200
Harga di atas EMA 50
PSAR di bawah lilin
Bollinger Bands melebar ke atas
→ Menunjukkan momentum naik yang kuat
Struktur Bearish
EMA 50 di bawah EMA 200
Harga di bawah EMA 50
PSAR di atas lilin
Bollinger Bands melebar ke bawah
→ Menunjukkan momentum turun yang kuat
6. Deteksi Fase Pasar
Indikator ini membantu mengidentifikasi 3 fase pasar:
Fase Tren
EMA sejajar
PSAR konsisten
Pita melebar
Terbaik untuk perdagangan kelanjutan.
Fase Kompresi
Pita rapat
EMA datar
PSAR sering berbalik
Terbaik menunggu breakout.
Fase Transisi
Persilangan EMA terbentuk
PSAR berbalik
Pita melebar
Potensi pembalikan awal.
7. Contoh Alur Praktis
Contoh urutan bullish:
Pita menyempit
Lilin bullish kuat menembus pita atas
EMA 50 melintasi di atas EMA 200
PSAR berbalik di bawah harga
Urutan ini menunjukkan:
Ekspansi volatilitas
Konfirmasi tren
Dukungan kelanjutan
8. Apa yang TIDAK Dilakukan
Tidak memprediksi berita
Tidak menjamin pembalikan
Tidak mengukur aliran order
Tidak menghilangkan breakout palsu
Ini memberikan konfirmasi terstruktur, bukan kepastian.
9. Model Logika Ringkasan
Filter Tren → EMA
Pemicu Volatilitas → Bollinger Bands
Waktu & Jejak → Parabolic SAR
Bersama-sama, mereka mengurangi entri acak dan meningkatkan pengambilan keputusan yang terstruktur.
Yang baik dari indikator ini adalah dapat dikonfigurasi dan Tidak perlu mengatur banyak indikator.
Ringkasan
1. Exponential Moving Averages (EMA 50 and EMA 200) to determine trend direction—EMA 50 reacts faster to price changes, while EMA 200 provides a longer-term trend perspective. The relative position of these EMAs signals bullish or bearish trends and potential trend shifts.
2. Bollinger Bands to measure market volatility and detect phases of compression (low volatility) and expansion (high volatility). Narrow bands indicate potential breakout setups, while price touching outer bands suggests possible overextension.
3. Parabolic SAR to identify trend continuation and reversal timing by plotting dots above or below price, signaling active uptrends or downtrends and potential reversals when dots flip position.
Together, these components form a structured decision framework that helps identify market phases—trending, compression, and transition—and supports confirmation of trend strength and momentum. The indicator is configurable and designed to reduce random entries by combining trend filtering, volatility triggers, and timing signals. It is applicable across various markets including Forex, cryptocurrencies, stocks, commodities, and indices. This tool provides structured confirmation for trading decisions but does not predict news events, guarantee reversals, or eliminate false breakouts.
Ulasan pelanggan
5 | 50 % | |
4 | 50 % | |
3 | 0 % | |
2 | 0 % | |
1 | 0 % |


