Deskripsi
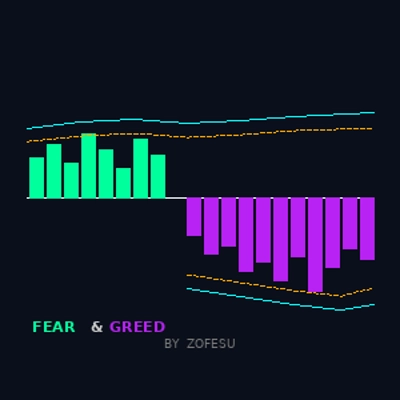
📊 Fear & Greed oleh Zofesu — Mesin VIX Ganda | Deteksi Sentimen Institusional
Fear & Greed adalah osilator presisi yang dibangun pada mesin Williams VIX Fix ganda — satu dikalibrasi untuk panik (Fear), satu untuk euforia (Greed). Ini mengidentifikasi momen ketika pemanasan berlebihan institusional mencapai tingkat ekstrem secara statistik, menandakan zona pembalikan dengan probabilitas tinggi.
⚙ CARA KERJANYA
Indikator menjalankan dua perhitungan WVF independen:
Mesin Fear — mengukur seberapa jauh low saat ini dari penutupan tertinggi baru-baru ini. Lonjakan menandakan kapitulas dan panik.
Mesin Greed — mengukur seberapa jauh high saat ini dari low terendah baru-baru ini. Lonjakan menandakan ekstensi berlebihan yang euforia.
Setiap mesin disaring melalui dua ambang independen:
1. Batas atas/bawah Bollinger Band (2× StdDev)
2. Ambang peringkat persentil (dapat dikonfigurasi)
Bar histogram muncul HANYA ketika harga melewati KEDUA atau SALAH SATU ambang — menghilangkan noise dan hanya menampilkan ekstrem yang signifikan secara statistik.
🔑FITUR UTAMA
✅ Mesin WVF ganda — Fear (Lime) dan Greed (Ungu) dihitung secara independen dengan jendela lookback terpisah
✅ BB Bands — batas Bollinger Band dinamis untuk setiap mesin
✅ Garis Persentil — ambang peringkat persentil yang dapat dikonfigurasi
✅ Output histogram bersih — bar hanya terlihat pada pembacaan ekstrem
✅ Semua 4 garis batas dapat diaktifkan/nonaktifkan secara independen
✅ Sepenuhnya dapat dikonfigurasi — lookback dan persentil terpisah untuk Fear dan Greed
✅ Bekerja pada semua aset dan kerangka waktu
✅ C# ringan — tanpa dampak kinerja
📚CARA MENGGUNAKAN
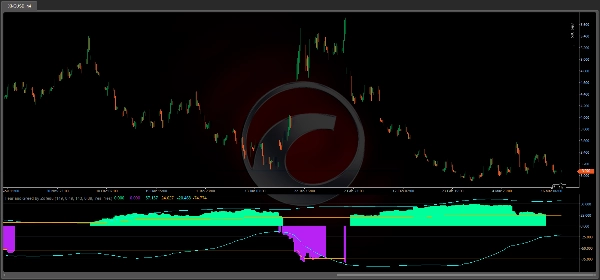
1. Tambahkan indikator ke grafik mana pun sebagai panel terpisah
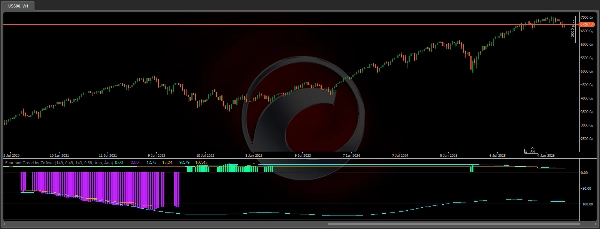
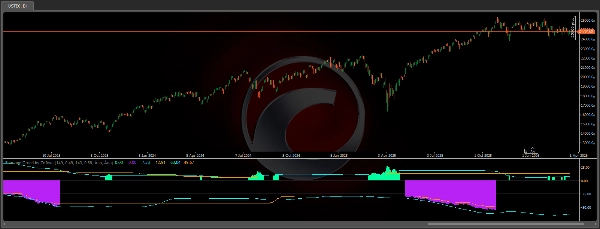
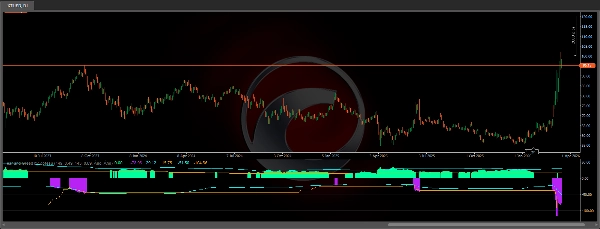
2. Histogram Lime = lonjakan Fear — zona pembalikan bullish potensial
3. Histogram Ungu = lonjakan Greed — zona pembalikan bearish potensial
4. Garis Aqua = batas BB untuk setiap mesin
5. Garis putus-putus Oranye = ambang persentil
6. Gunakan bersamaan dengan aksi harga, level S/R, SuperTrend atau VWAP
7. Kerangka waktu lebih tinggi (D1, W1) menghasilkan sinyal paling dapat diandalkan Hasil terbaik pada: H1, H4, D1 Bekerja pada: Indeks (NAS100, SPX500), Crypto (BTCUSD), Forex, Emas, Minyak, Saham.
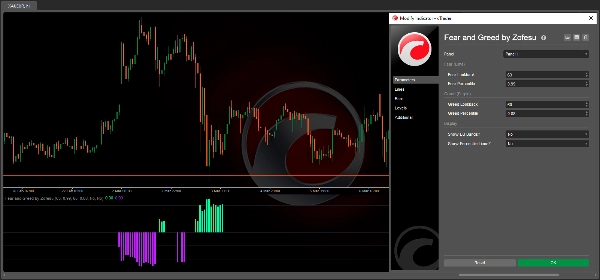
🔗PARAMETER
Fear (Lime):
- Lookback Fear — bar untuk perhitungan WVF dan BB (default 149)
- Persentil Fear — ambang peringkat persentil (default 0,49)
Greed (Ungu):
- Lookback Greed — bar untuk perhitungan WVF dan BB (default 143)
- Persentil Greed — ambang peringkat persentil (default 0,89)
Tampilan:
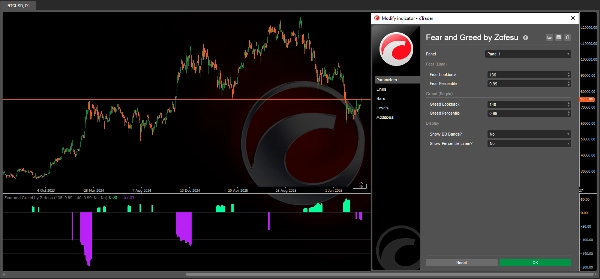
- Tampilkan BB Bands — aktifkan/nonaktifkan garis batas aqua
- Tampilkan Garis Persentil — aktifkan/nonaktifkan garis ambang oranye
🎯 PANDUAN KALIBRASI (BERDASARKAN PENGALAMAN)
Setiap aset dan kerangka waktu memerlukan pengaturan uniknya sendiri — indikator ini dibuat untuk memungkinkan fleksibilitas ini.
Langkah 1 — Temukan Lookback yang tepat:
Atur Persentil ke 0,99 terlebih dahulu, lalu coba nilai Lookback antara 10 dan 1000.
Lookback yang lebih tinggi mengurangi noise tetapi juga dapat menyembunyikan sinyal yang valid. Rentang yang direkomendasikan adalah 50–500 untuk sebagian besar pengaturan.
Langkah 2 — Sesuaikan Persentil:
Setelah menemukan Lookback yang tepat, kurangi Persentil secara bertahap dari 0,99 ke bawah. Ini melonggarkan filter dan mengungkapkan sinyal tambahan. Parameter Fear dan Greed tidak perlu sama.
Langkah 3 — Interpretasi sinyal:
- Bar Fear menghilang pada candle tertutup → potensi entri Long pada candle berikutnya.
- Bar Greed menghilang pada candle tertutup → potensi entri Short pada candle berikutnya.
- Fear atau Greed tetap menyala selama beberapa bar = pasar sedang tren atau mengakumulasi posisi — tidak selalu pembalikan.
- Kedua Fear dan Greed menyala bersamaan = tekanan yang bertentangan. Periksa kerangka waktu lebih tinggi terlebih dahulu. Apakah ada level S/R kunci di dekatnya? Jika ya, tunggu konfirmasi sebelum masuk.
Jumlah sinyal sepenuhnya tergantung pada Anda dan strategi Anda — pengaturan yang lebih ketat memberikan entri lebih sedikit tetapi berkualitas lebih tinggi. Setelah pengaturan yang benar, Anda dapat mematikan garis di pengaturan agar tidak mengganggu Anda.
⚠️ PENOLAKAN Risiko besar kehilangan terlibat dalam perdagangan instrumen keuangan. Kinerja masa lalu dari indikator atau strategi apa pun tidak menjamin hasil di masa depan. Alat ini disediakan hanya untuk tujuan informasi dan edukasi. Selalu gunakan manajemen risiko yang tepat dan jangan pernah mempertaruhkan lebih dari yang Anda mampu untuk kehilangan. Penulis tidak bertanggung jawab atas kerugian perdagangan yang terjadi melalui penggunaan indikator ini.
Ringkasan
Ulasan pelanggan
5 | 0 % | |
4 | 100 % | |
3 | 0 % | |
2 | 0 % | |
1 | 0 % |


