
Description
MACD Sniper Elite Multi-Timeframe est une carte thermique MACD multi-échelle de précision conçue pour les traders qui souhaitent un alignement de tendance plus rapide, une confirmation de momentum plus claire et un timing de trade plus précis.
Au lieu de regarder plusieurs graphiques et de comparer manuellement les conditions MACD entre les différentes échelles de temps, cet indicateur compresse ces informations dans une puissante sous-fenêtre avec une présentation visuelle propre en 3 rangées. Chaque rangée représente une échelle de temps sélectionnable et montre instantanément si le momentum MACD se renforce, faiblit, est haussier ou baissier.
Le résultat est simple : vous pouvez repérer l'alignement plus rapidement, filtrer les configurations faibles plus tôt et vous concentrer sur des entrées à haute probabilité avec plus de confiance.
Pourquoi les traders l’aiment
Clarté multi-échelle en un coup d'œil
Voir les conditions MACD de 3 échelles de temps différentes dans un panneau compact.
Conçu pour une prise de décision rapide
Plus besoin de changer de graphiques pour confirmer la direction du momentum.
Visualisation de la force de la tendance
Le moteur de couleur fait plus que montrer la direction. Il met aussi en évidence si le momentum s'accélère ou s'affaiblit.
Entrées de style sniper
Parfait pour les traders qui veulent aligner les entrées sur des échelles de temps inférieures avec le momentum des échelles supérieures.
Design épuré et efficace
L'affichage est minimaliste, lisible et optimisé pour une analyse rapide des graphiques.
Comment ça fonctionne
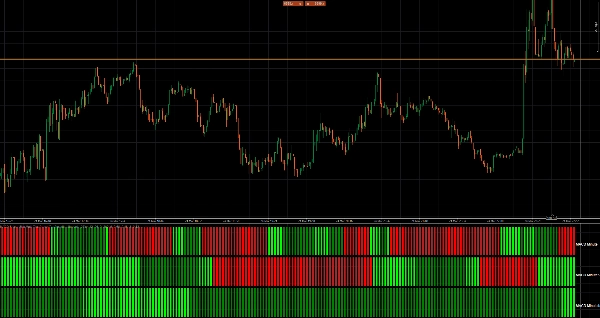
L'indicateur utilise une carte thermique multi-échelle à 3 rangées.
- Rangée 1 = échelle de temps MACD sélectionnable
- Rangée 2 = échelle de temps MACD sélectionnable
- Rangée 3 = échelle de temps MACD sélectionnable
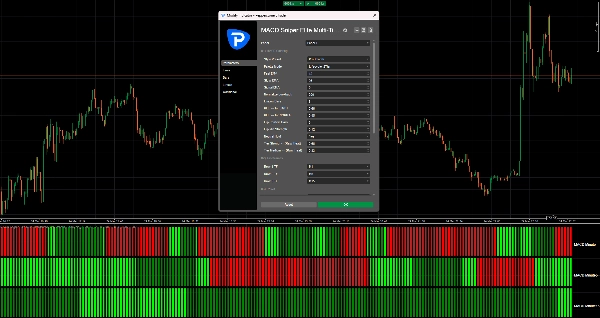
Chaque rangée calcule son propre MACD en utilisant :
- EMA rapide
- EMA lente
- EMA signal
Par défaut, l'indicateur utilise les réglages classiques du MACD :
- EMA rapide = 12
- EMA lente = 26
- EMA signal = 9
Logique des couleurs
Chaque rangée est codée par couleur pour montrer à la fois :
- la direction
- la qualité du momentum
Les tons verts indiquent une pression MACD haussière.
Les tons rouges indiquent une pression MACD baissière.
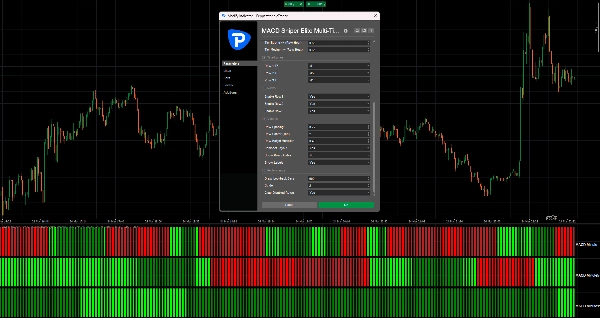
Selon le mode de palette sélectionné, les couleurs peuvent montrer :
- activation forte de la tendance
- momentum de tendance soutenu
- affaiblissement des conditions de tendance
- intensité brute du momentum
Mode cycle de vie à 2 niveaux
C'est l'un des modes visuels les plus puissants de l'indicateur.
Dans ce mode :
- Vert clair / Rouge clair = momentum de tendance frais ou fort
- Vert normal / Rouge normal = le momentum est encore valide, mais commence à faiblir
Cela facilite grandement l'identification d'un mouvement encore en expansion ou déjà en perte de puissance.
Modes cycle de vie à 3 niveaux et chaleur brute
Pour les traders qui veulent encore plus de détails visuels, l'indicateur inclut également :
- Cycle de vie à 3 niveaux
- Chaleur brute à 3 niveaux
Ces modes ajoutent plus de gradation à la force du momentum et au développement de la tendance.
Meilleur cas d'utilisation
MACD Sniper Elite Multi-Timeframe est idéal pour les traders qui veulent :
- aligner les entrées sur des échelles de temps inférieures avec la tendance des échelles supérieures
- éviter de trader contre le momentum
- confirmer la continuation de la tendance
- repérer les tendances qui s'affaiblissent avant que les retournements ne deviennent évidents
- simplifier l'analyse multi-échelle
Il fonctionne particulièrement bien pour :
- le scalping
- le trading intraday
- le day trading
- le trading de momentum
- les stratégies de suivi de tendance
Exemple de flux de travail
Une façon courante d'utiliser l'indicateur est :
- Rangée 1 = momentum de l'échelle de temps d'entrée
- Rangée 2 = échelle de temps de confirmation
- Rangée 3 = tendance de l'échelle de temps supérieure
Par exemple :
- Rangée 1 = M1
- Rangée 2 = M5
- Rangée 3 = M15
Lorsque toutes les rangées deviennent haussières, le momentum est aligné.
Lorsque la rangée inférieure faiblit tandis que les rangées supérieures restent fortes, cela peut signaler soit un retracement, soit un mouvement en phase finale.
Lorsque toutes les rangées changent ensemble, cela indique souvent une phase directionnelle plus forte.
Avantages clés
- 3 échelles de temps MACD entièrement sélectionnables
- réglages classiques du MACD inclus
- moteur de couleur premium de style carte thermique
- visualisation du cycle de vie de la tendance
- design compact en sous-fenêtre
- étiquettes faciles à lire
- optimisé pour un flux de travail plus rapide
- idéal pour les traders d'entrées précises
Résumé
Avis clients
5 | 50 % | |
4 | 50 % | |
3 | 0 % | |
2 | 0 % | |
1 | 0 % |


