Deskripsi
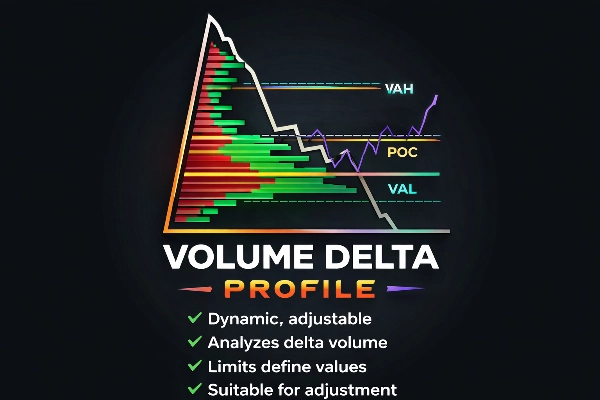
Profil Delta Volume
Wawasan Aliran Pesanan Profesional untuk Pedagang Lanjutan
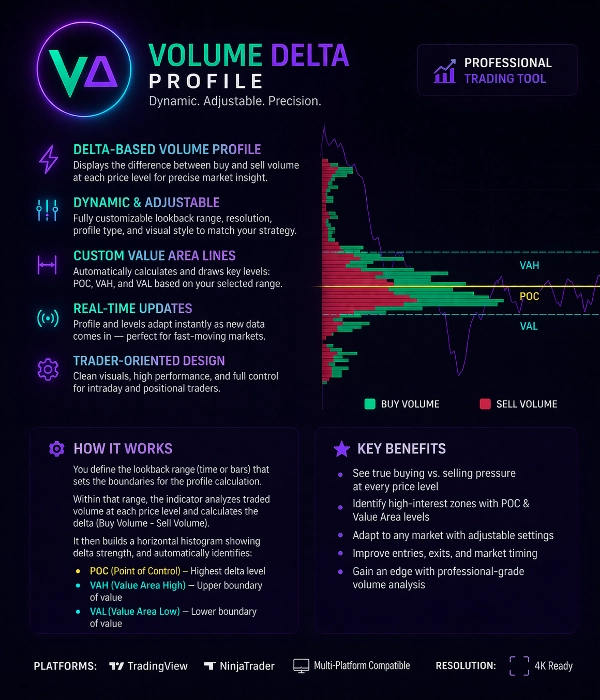
Profil Delta Volume adalah alat perdagangan yang kuat yang dirancang untuk mengungkap keseimbangan sebenarnya antara pembeli dan penjual di setiap tingkat harga.
Berbeda dengan profil volume tradisional, indikator ini menganalisis Delta Volume (Volume Beli – Volume Jual) untuk menunjukkan di mana peserta pasar agresif mendominasi.
Ini membantu pedagang mengidentifikasi aktivitas institusional, zona absorpsi, dan tingkat harga dengan minat tinggi dengan presisi.
Fitur Utama
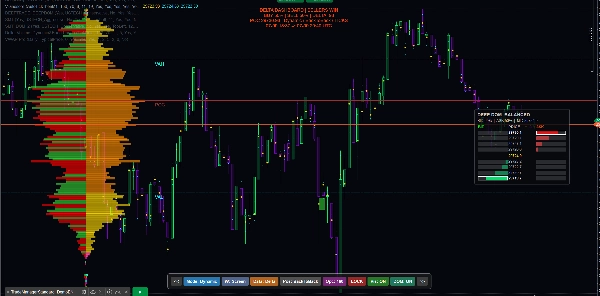
Profil Volume Berbasis Delta
Indikator menghitung delta volume di setiap tingkat harga, memisahkan:
• Tekanan beli agresif
• Tekanan jual agresif
Ini mengungkap siapa yang sebenarnya mengendalikan pasar.
Rentang Profil Dinamis & Dapat Disesuaikan
Rentang perhitungan profil sepenuhnya dapat disesuaikan.
Pengguna dapat menentukan area perhitungan dengan:
• Rentang bar kustom
• Rentang sesi
• Seleksi manual
• Rentang dinamis bergulir
Profil secara otomatis memperbarui saat data baru tiba.
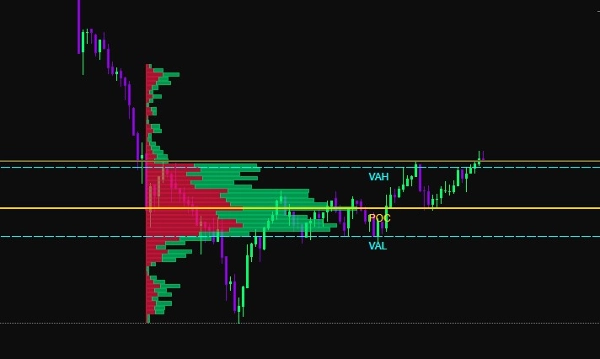
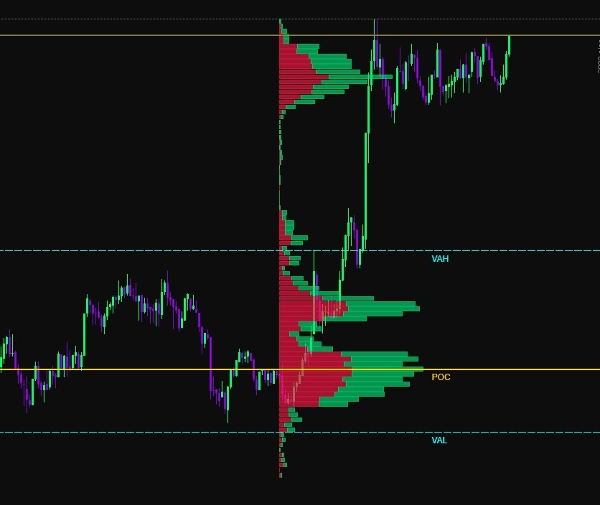
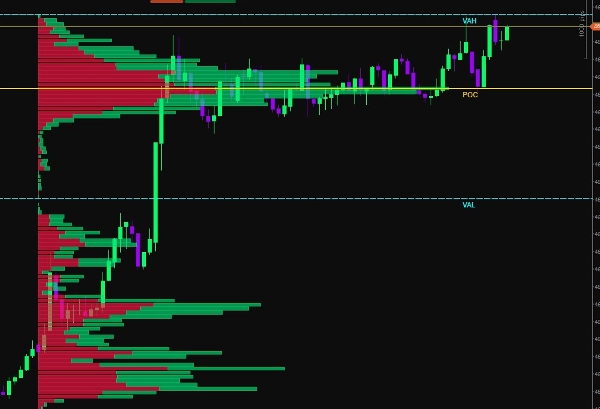
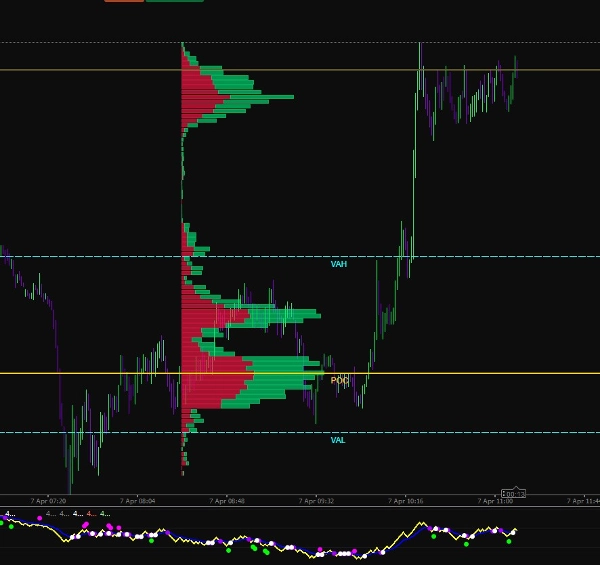
Deteksi Area Nilai
Indikator secara otomatis menghitung tingkat struktur pasar utama:
POC (Titik Kontrol)
Tingkat harga dengan volume delta perdagangan tertinggi.
VAH (Area Nilai Atas)
Batas atas area nilai.
VAL (Area Nilai Bawah)
Batas bawah area nilai.
Tingkat ini menyoroti di mana mayoritas aktivitas pasar terjadi.
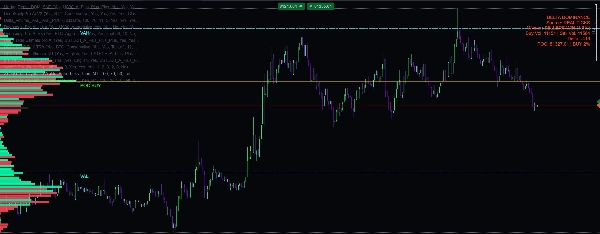
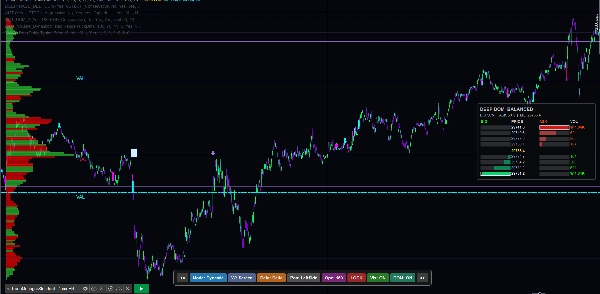
Visualisasi Beli vs Jual
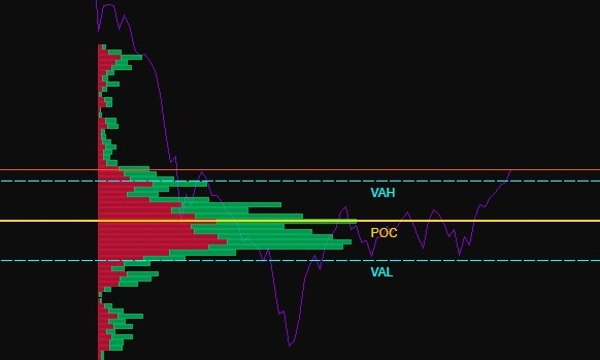
Volume ditampilkan sebagai histogram horizontal:
Bar hijau → Volume Beli Dominan
Bar merah → Volume Jual Dominan
Ini memungkinkan pedagang untuk langsung melihat:
• Zona absorpsi
• Area ketidakseimbangan
• Klaster likuiditas
• Jejak institusional
Visualisasi Adaptif
Indikator mencakup beberapa opsi kustomisasi visual:
• Lebar histogram yang dapat disesuaikan
• Skema warna kustom
• Transparansi yang dapat disesuaikan
• Kontrol resolusi
• Rendering adaptif zoom
Ini memastikan visualisasi yang jelas pada semua kerangka waktu grafik.
Tingkat Batas Pintar
Indikator menggambar tingkat referensi dinamis:
• Garis POC
• Garis VAH
• Garis VAL
Tingkat ini diperbarui secara otomatis berdasarkan rentang profil yang dipilih dan dapat digunakan sebagai:
• Dukungan / Resistensi
• Zona pembalikan rata-rata
• Tingkat konfirmasi breakout
Perhitungan Waktu Nyata
Profil Delta Volume terus menghitung ulang menggunakan data pasar langsung.
Ini memastikan pedagang selalu melihat informasi aliran pesanan yang terbaru selama pasar yang cepat.
Kasus Penggunaan
Alat ini ideal untuk:
• Scalping
• Perdagangan intraday
• Perdagangan futures
• Analisis aliran pesanan
• Pelacakan likuiditas
• Deteksi jejak institusional
Keuntungan Perdagangan Utama
✔ Mengidentifikasi tekanan beli vs jual yang sebenarnya
✔ Mendeteksi zona absorpsi dan kelelahan
✔ Menemukan tingkat likuiditas tinggi
✔ Meningkatkan presisi masuk
✔ Mengonfirmasi breakout atau pembalikan
✔ Memahami struktur pasar
Spesifikasi Teknis
Metode Perhitungan:
Delta Volume = Volume Beli − Volume Jual
Tipe Profil:
Histogram Tingkat Harga Horizontal
Tingkat Otomatis:
POC, VAH, VAL
Mode Pembaruan:
Pembaruan Dinamis Waktu Nyata
Pengaturan Kustom:
• Rentang Profil
• Resolusi Histogram
• Skala Volume
• Pengaturan Warna
• Visibilitas Tingkat
Kompatibilitas Platform:
Dioptimalkan untuk rendering grafik berkinerja tinggi
Dirancang untuk Pedagang Profesional
Profil Delta Volume dibuat untuk pedagang yang ingin melampaui indikator dasar dan memahami mekanisme nyata pasar.
Dengan menggabungkan analisis volume, perhitungan delta, dan struktur area nilai, alat ini memberikan pandangan jelas tentang partisipasi pasar dan distribusi likuiditas.
Ringkasan
Users can customize the profile calculation range using options such as custom bar range, session range, manual selection, or rolling dynamic range, with real-time updates as new market data arrives. Key market structure levels—Point of Control (POC), Value Area High (VAH), and Value Area Low (VAL)—are automatically calculated and drawn as dynamic reference lines, useful for support/resistance, mean reversion, and breakout confirmation.
Additional features include adjustable histogram width, color schemes, transparency, resolution control, and zoom-adaptive rendering for clear visualization across all chart timeframes. The tool supports use cases like scalping, intraday trading, futures trading, order flow analysis, liquidity tracking, and institutional footprint detection. It is optimized for high-performance chart rendering and aims to provide traders with precise insights into market participation and liquidity distribution.