
ICT First Presented FVG
Indicatore
187 download
Versione 1.1, Apr 2026
Windows, Mac

Descrizione
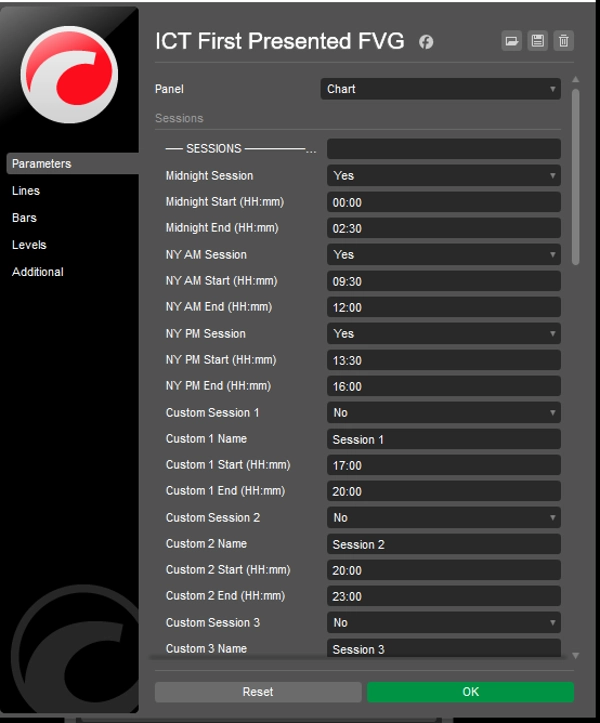
Questo è un indicatore specializzato basato su ICT che si concentra su un unico punto "ancora": l'apertura della Borsa di New York alle 9:30.
Ecco la spiegazione diretta al punto:
🎯 Funzione principale
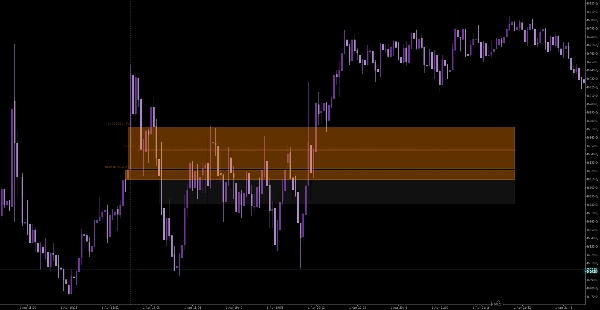
L'indicatore ignora tutta l'azione del prezzo fino all'apertura delle 9:30. Una volta che il mercato apre, cerca il primo Fair Value Gap (FVG) che appare. Nella teoria ICT, questo primo gap è spesso la "impronta istituzionale" per la direzione della sessione mattutina.
🛠️ Caratteristiche principali
- Caccia automatizzata: Non devi scansionare tu stesso il grafico a 1 o 5 minuti; evidenzia immediatamente il primo squilibrio valido dopo il segnale di apertura.
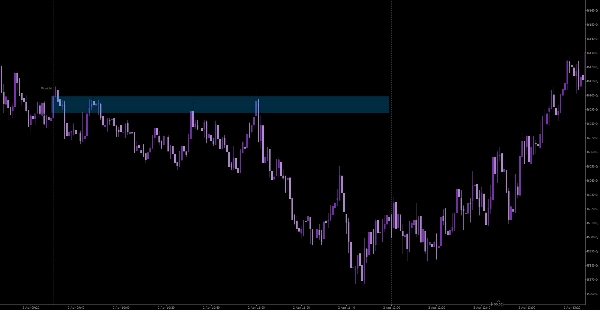
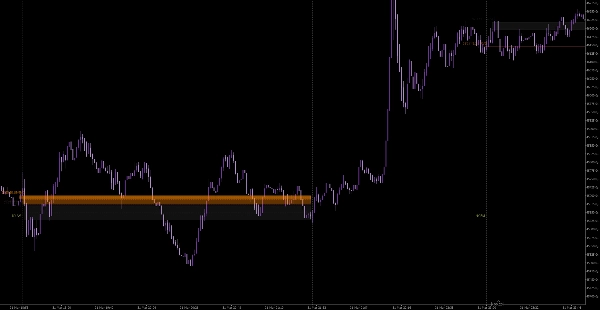
- Rettangoli estesi: Disegna un rettangolo che si proietta fino al prezzo attuale. Questo ti permette di vedere se il prezzo "ritesta" o "riempie" quel gap specifico della mattina più tardi nella giornata.
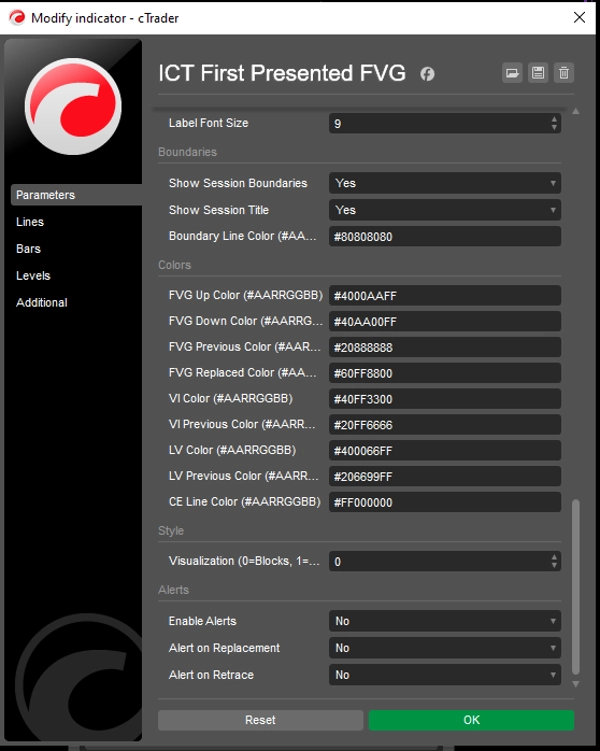
- Controllo visivo: Puoi passare tra blocchi solidi o linee semplici e cambiare i colori per adattarli al tuo template di grafico.
- Tracciamento dei pattern: Aggiunge etichette di data così puoi guardare indietro ai giorni precedenti per vedere quanto spesso il FVG delle 9:30 ha tenuto come supporto o resistenza.
💡 Come puoi fare meglio
Sebbene questo strumento sia ottimo per trovare il "setup", non ti dà il "contesto". Per migliorare il tuo tasso di successo con questo:
- Bias su timeframe più alti: Prendi un FVG "Long" alle 9:30 solo se la tua tendenza a 1 ora o 4 ore è già rialzista. Se prendi ogni "primo FVG" alla cieca, verrai tritato.
- Aspetta il "Judas Swing": Spesso, il primo FVG alle 9:30 è una trappola (il falso movimento). Se il primo FVG fallisce e il prezzo crea un secondo nella direzione opposta, quello è di solito il vero movimento della giornata.
- La regola del "Fill": Se il prezzo torna indietro e chiude completamente il FVG delle 9:30, la sua "forza" istituzionale è sparita. Cerca solo operazioni dove il prezzo tocca il bordo del rettangolo e reagisce allontanandosene.
Riepilogo
Riepilogo AI
ICT First Presented FVG is a specialized trading indicator based on Inner Circle Trader (ICT) theory, designed to identify the first Fair Value Gap (FVG) that forms immediately after the 9:30 AM New York Stock Exchange open. This initial gap is considered a key institutional footprint indicating the morning session’s directional bias.
Key features include automated detection of the first valid imbalance after the market opens, eliminating the need for manual scanning of short-term charts. The indicator visually highlights this gap with an extended box projecting forward to the current price, allowing traders to monitor if and when the gap is retested or filled during the day. Users can customize the visual style with solid blocks or lines and adjust colors to match their chart templates. Additionally, date labels track past occurrences to analyze how often the 9:30 AM FVG acts as support or resistance.
The indicator supports markets including Forex, indices, commodities, stocks, and cryptocurrencies such as BTCUSD and EURUSD. It is intended to be used alongside higher timeframe trend analysis and price action context to improve trade decision-making, particularly by observing patterns like the "Judas Swing" and the behavior of price around the FVG fill level.
Profilo indicatore
Recensioni dei clienti
0.0
Recensioni: 0
Recensioni dei clienti
Questo prodotto non ha ancora ricevuto recensioni. L'hai già provato? Fallo sapere agli altri per primo!
Discussioni
Domande frequenti
BTCUSD
Forex
Signal
Breakout
Indices
EURUSD
Commodities
GBPUSD
NZDUSD
Martingale
Prop
Scalping
SMC
Crypto
Grid
Stocks
AI
XAUUSD
NAS100
USDJPY
I prodotti disponibili tramite cTrader Store, inclusi bot di trading, indicatori e plugin, sono forniti da sviluppatori terzi e resi disponibili esclusivamente a scopo informativo e di accesso tecnico. cTrader Store non è un broker e non fornisce consulenze in materia di investimento, raccomandazioni individualizzate o garanzie di risultati futuri.
Altro da questo autore


Prezzo
2.84K
Installazioni gratuite