
WeTrades Liquidity Swings
Indikator
172 unduhan
Versi 1.0, Apr 2026
Windows, Mac

Deskripsi
Pergerakan Likuiditas
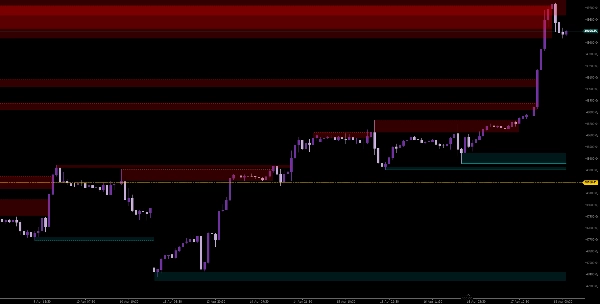
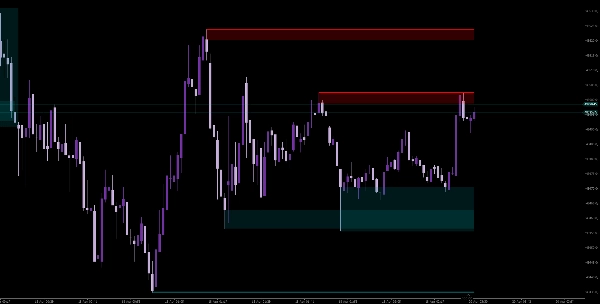
Pergerakan Likuiditas adalah alat presisi yang dirancang untuk mengidentifikasi dan memvisualisasikan zona likuiditas utama yang terbentuk di sekitar puncak dan lembah ayunan. Dibuat untuk trader yang fokus pada struktur pasar, indikator ini menyoroti area di mana harga kemungkinan akan bereaksi, berbalik, atau menembus dengan momentum.
Fitur Utama
- Deteksi Ayunan Otomatis
Mengidentifikasi pivot tertinggi dan terendah menggunakan periode lookback yang dapat dikonfigurasi. - Visualisasi Zona Likuiditas
Menampilkan zona berdasarkan: -
- Ujung sumbu (entri presisi)
- Rentang lilin penuh (area likuiditas yang lebih luas)
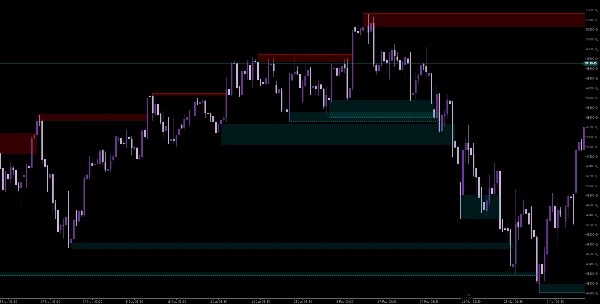
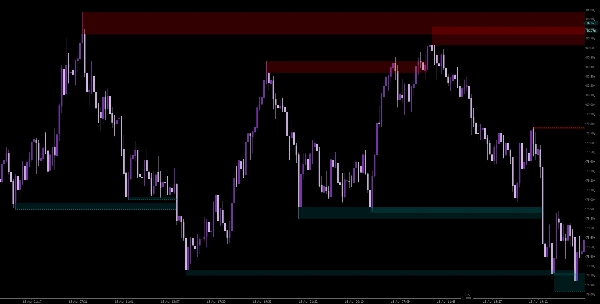
- Pelacakan Jumlah Sentuhan
Menghitung berapa kali harga berinteraksi dengan setiap zona, membantu Anda mengukur kekuatan dan signifikansi. - Konfirmasi Break
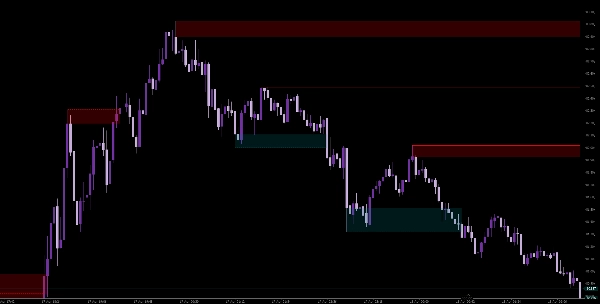
Menandai dengan jelas saat level likuiditas ditembus dengan penutupan yang dikonfirmasi melewati level tersebut. - Objek Grafik Dinamis
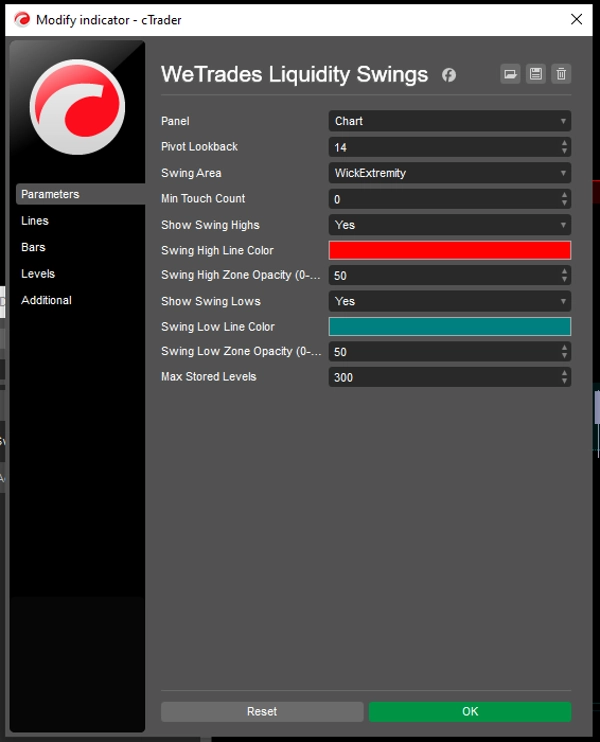
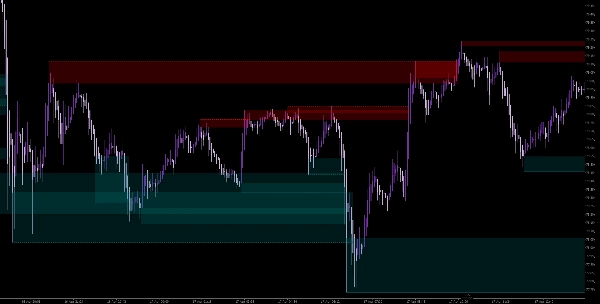
Zona dan level diperpanjang secara real time dan hanya diperbarui pada lilin yang dikonfirmasi untuk akurasi. - Penampilan yang Dapat Disesuaikan
-
- Warna terpisah untuk puncak dan lembah
- Opasitas zona yang dapat disesuaikan
- Tampilan opsional untuk puncak/lembah ayunan
- Dioptimalkan untuk Performa
Penanganan objek grafik yang efisien dengan batas yang dapat dikonfigurasi pada level yang disimpan.
Bagaimana Ini Membantu Anda Berdagang
- Mengidentifikasi kolam likuiditas di mana stop kemungkinan berada
- Menemukan zona penolakan untuk potensi pembalikan
- Mengonfirmasi breakout dengan validasi berbasis struktur
- Meningkatkan presisi entri menggunakan sentuhan berulang
Kasus Penggunaan Terbaik
- Konsep Uang Pintar (SMC)
- Strategi perdagangan berbasis likuiditas
- Penyempurnaan Support & Resistance
- Setup breakout dan retest
Parameter
- Pivot Lookback – Mendefinisikan sensitivitas ayunan
- Mode Area Ayunan – Sumbu atau rentang penuh
- Jumlah Sentuhan Minimum – Menyaring level yang lebih lemah
- Maksimum Level Tersimpan – Mengontrol kekacauan grafik
Ringkasan
Ringkasan AI
WeTrades Liquidity Swings is a technical indicator designed to identify and visualize key liquidity zones around swing highs and lows on price charts. It automatically detects pivot points using a configurable lookback period and highlights liquidity zones based on either wick extremities for precise entries or full candle ranges for broader areas. The indicator tracks how many times price touches each zone, aiding in assessing their strength, and confirms breaks by marking when price closes beyond a liquidity level. Zones dynamically extend in real time and update only on confirmed candles to maintain accuracy. Users can customize the appearance with separate colors for highs and lows, adjustable opacity, and optional swing point display. The tool is optimized for performance with limits on stored levels to reduce chart clutter. It supports trading approaches focused on Smart Money Concepts, liquidity-based strategies, refined support and resistance, and breakout/retest setups. Parameters include pivot lookback sensitivity, swing area mode, minimum touch count filter, and maximum stored levels. This indicator provides visual structure clarity to help traders identify liquidity pools, rejection zones, confirm breakouts, and improve entry precision.
Profil indikator
Kategori indikator
Support & resistance
Tipe output
Visualisasi
Persyaratan data
Hanya batang
Sinyal yang didukung
Breakout
Reversal
Level tersentuh
Level tertembus
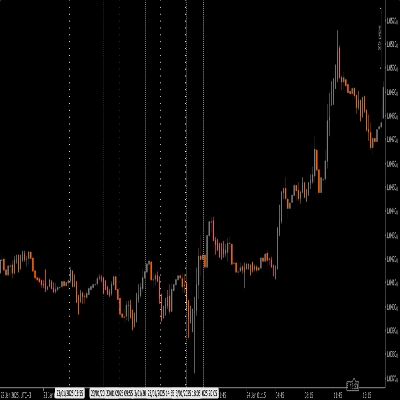
Rentang sesi pembukaan
Ulasan pelanggan
0.0
Ulasan: 0
Ulasan pelanggan
Belum ada ulasan untuk produk ini. Sudah mencobanya? Jadilah pemberi ulasan pertama!
Diskusi
Pertanyaan umum
Key Levels
MSS
Market Structure
Support & Resistance
Produk-produk yang tersedia melalui cTrader Store, termasuk bot trading, indikator, dan plugin, disediakan oleh pengembang pihak ketiga serta hanya ditujukan untuk akses teknis dan informasi. cTrader Store bukan broker dan tidak menyediakan saran investasi, rekomendasi pribadi, atau jaminan apa pun tentang kinerja di masa mendatang.
Produk lain dari penulis ini


Harga
2.57K
Instal gratis