
Описание
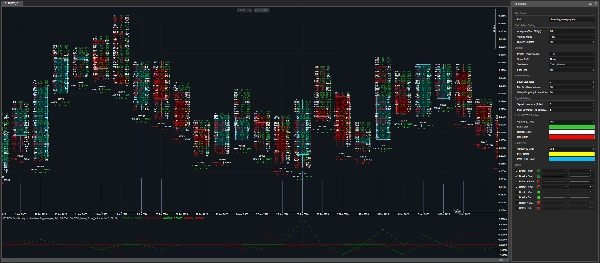
Volume Profile TPO Bubble — by The Quant
Volume Profile TPO Bubble is a premium cTrader indicator created by The Quant.
Want to join us ? Links in bio
━━━━━━━━━━━━━━━━━━━━━━
VOLUME PROFILE TPO BUBBLE
━━━━━━━━━━━━━━━━━━━━━━
Volume Profile TPO Bubble is a complete market-reading indicator for cTrader.
It brings together powerful market-reading tools in one clean indicator:
◆ Volume Profile
◆ Bubble Chart
◆ TPO
◆ POC Break & Retest signals for robots
This tool is designed for traders who want to read volume zones more clearly, identify important POC levels, and use those levels inside manual or automated strategies.
It is built for cTrader, with both visual analysis and cBot automation in mind.
━━━━━━━━━━━━━━━━━━━━━━
WHAT THIS INDICATOR DOES
━━━━━━━━━━━━━━━━━━━━━━
Market Activity Zones
Volume Profile TPO Bubble helps you identify the zones where the market has been active.
These zones are called POCs, or Points of Control.
A POC is a price area where activity was concentrated.
When price comes back to this area, it may break it, retest it, reject it, or react from it.
Main Objective
The goal is not to predict the market.
The goal is to make important market zones easier to see, easier to understand, and easier to use in a strategy.
━━━━━━━━━━━━━━━━━━━━━━
MAIN VISUAL MODES
━━━━━━━━━━━━━━━━━━━━━━
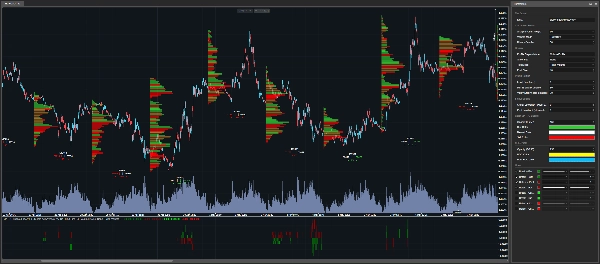
◆ Volume Profile
The Volume Profile mode displays horizontal volume bars directly on the cTrader chart.
The bigger the bar, the more important the price zone was during the selected analysis candle.
This mode is useful when you want to see the full structure of volume distribution.
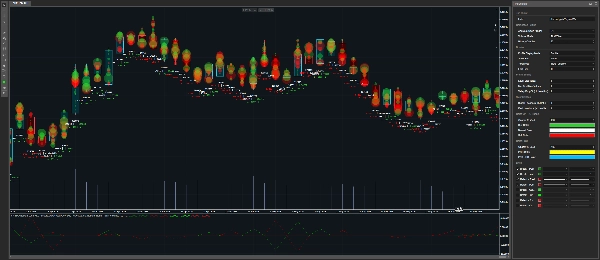
◆ Bubble Chart
The Bubble Chart mode displays important volume zones as bubbles.
The bigger the bubble, the more important the detected zone is.
This mode is made for fast visual reading.
It helps you quickly spot the most important areas on the chart.
If you want to use the indicator mainly as a Bubble Chart, you can set Show POC to None, then adjust:
• Min % of Max Volume
• Valley Drop %
These settings control how many bubbles you want to see.
Lower values show more bubbles.
Higher values keep only the cleanest zones.
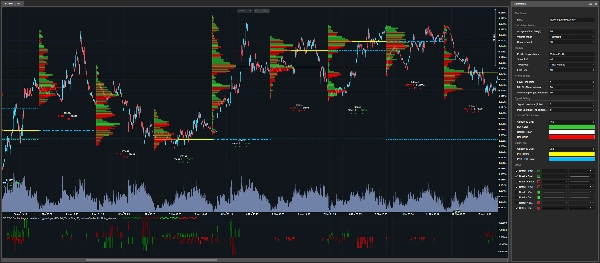
◆ TPO
The TPO mode gives a more detailed view of what happened inside a candle.
It displays:
• Buy volume
• Sell volume
• Delta
• Price-level activity
This mode is useful when you want to understand the internal structure of a zone, not just see where the volume was.
━━━━━━━━━━━━━━━━━━━━━━
TICK AND TICKXSIZE LOGIC
━━━━━━━━━━━━━━━━━━━━━━
CFD Volume Context
On CFDs, traders do not receive centralized exchange volume like on futures markets.
Instead, volume is based on broker tick data.
This indicator gives you two volume calculation modes:
• Tick
• TickXSize
◆ Tick
Each tick counts as one unit.
This is the simple reading of the broker tick flow.
◆ TickXSize
Ticks are weighted by the size of the price movement.
A tick that moves price by 1 pip has more weight than a tick that moves price by 0.1 pip.
This can help reveal zones where the movement had more impact, even if the raw tick count alone does not make the zone obvious.
Simple Difference
Tick counts events.
TickXSize counts events with the weight of the movement.
━━━━━━━━━━━━━━━━━━━━━━
POC DETECTION
━━━━━━━━━━━━━━━━━━━━━━
How POCs Are Detected
The indicator detects POC zones using volume peaks and filtering logic.
A zone must be strong enough and isolated enough to be considered relevant.
This helps avoid displaying every small noisy area on the chart.
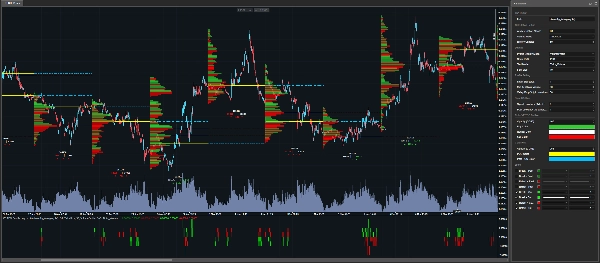
Current and Past POCs
Current POCs can be displayed directly on the chart.
They can also be extended into the next analysis candle with dotted lines.
Past POCs can also be displayed, allowing traders to track older levels that may still matter.
━━━━━━━━━━━━━━━━━━━━━━
ROBOT-READY BREAK & RETEST SIGNALS
━━━━━━━━━━━━━━━━━━━━━━
Visual Indicator and Automation Tool
Volume Profile TPO Bubble is not only a visual indicator.
It also exposes output series that can be used inside a cBot or trading robot.
Detected Signal Types
The indicator can detect:
• Break of current POC levels
• Retest of current POC levels
• Break of past POC levels
• Retest of past POC levels
This allows a robot to detect when price interacts with important volume zones.
━━━━━━━━━━━━━━━━━━━━━━
SIGNAL SCORES
━━━━━━━━━━━━━━━━━━━━━━
What the Score Means
The indicator does not only return a signal.
It also returns a score.
The score tells the robot which POC zone was touched, broken, or retested.
Score Logic
The ranking is based on the open price of the selected analysis candle.
Positive scores represent POC zones above the open.
Negative scores represent POC zones below the open.
Examples
• +1 = first POC zone above the open
• -1 = first POC zone below the open
• +2 = second POC zone above the open
• -3 = third POC zone below the open
The further the number is from zero, the further the zone is from the open.
Why It Matters for Automation
This is useful for automation because the robot does not only know that a signal happened.
It also knows where the signal happened.
━━━━━━━━━━━━━━━━━━━━━━
PARAMETERS
━━━━━━━━━━━━━━━━━━━━━━
All parameters are organized by category so you can quickly understand what each setting controls.
━━━━━━━━━━━━━━━━━━━━━━
CALCULATION SETTINGS
━━━━━━━━━━━━━━━━━━━━━━
◆ Analyse Timeframe
• Selects the timeframe used to build the profiles.
• This timeframe is the base used to build profiles, detect POCs, and organize signal scores.
Examples:
• Daily = one profile per day
• H4 = one profile every four hours
◆ Volume Mode
• Chooses how tick volume is calculated.
Available modes:
• Tick = one tick equals one unit
• TickXSize = ticks are weighted by price movement size
Tick is the simple mode.
TickXSize gives more importance to ticks that move price more strongly.
◆ History Candles
• Defines how many past candles from the selected Analyse Timeframe are kept on the chart.
• More candles give more historical context.
• Fewer candles keep the chart lighter.
• The indicator may keep a small additional margin internally so that POCs, Breaks, and Retests are calculated correctly.
━━━━━━━━━━━━━━━━━━━━━━
DISPLAY SETTINGS
━━━━━━━━━━━━━━━━━━━━━━
◆ Profile Display Mode
• Choose what is displayed on the chart:
• None
• Volume Profile
• Bubble
• TPO
None is useful for automation because it removes drawings from the chart while keeping the indicator outputs available.
This allows traders to keep a clean chart and still use the signals inside a robot.
◆ Show POC
• Controls which POC levels are displayed.
Available options:
• None = no POC lines
• PoC = current POC levels
• PoC Past = past POC levels
• All = current and past POC levels
Current POCs can be extended into the next analysis candle with dotted lines.
◆ Text Mode
• Controls the volume information displayed under the candle.
Available options:
• None = no text
• Ticks Volume = tick volume information
• Delta Percent = imbalance shown as percentage
For automation, this can be set to None to keep the chart clean.
◆ Font Size
• Controls the size of the displayed text.
• Increase it for better readability.
• Decrease it if the chart is too crowded.
━━━━━━━━━━━━━━━━━━━━━━
PROFILE SETTINGS
━━━━━━━━━━━━━━━━━━━━━━
◆ Level Size
• Controls the size of each price level.
• Smaller values give more detail.
• Larger values create a cleaner and lighter profile.
• The indicator includes a safety mechanism to avoid creating too many chart objects.
If a message recommends increasing Level Size, it means the indicator is protecting the chart from unnecessary overload.
In that case, a safe minimum level is already applied internally.
◆ Min % of Max Volume
• Filters zones based on their strength.
• The indicator first finds the strongest volume zone inside the candle.
• Then it keeps only the zones that reach at least the selected percentage of that maximum zone.
Example:
• If Min % of Max Volume is set to 80%, only zones with at least 80% of the highest volume zone can be selected.
Lower values show more zones.
Higher values show fewer but stronger zones.
Min % of Max Volume is the power filter.
◆ Valley Drop %
• Checks whether a POC is clearly isolated.
• Think of the POC as the top of a mountain.
• To confirm that it is a real peak, the indicator checks if volume drops enough around it.
Lower values accept more zones.
Higher values keep only cleaner and more separated zones.
Valley Drop is the isolation filter.
━━━━━━━━━━━━━━━━━━━━━━
SIGNAL SETTINGS
━━━━━━━━━━━━━━━━━━━━━━
◆ Signal Lookback
• Chooses which closed candle provides the POCs used for current Break and Retest signals.
Available values:
• 0 = last closed candle
• 1 = candle before the last closed candle
• 2 = even further back
This allows traders to test signals based on more recent or older POC references.
◆ Past Lookback
• Defines how many older candles are scanned to build past POC levels.
• A higher value allows the indicator to search for older POC zones that may still matter.
━━━━━━━━━━━━━━━━━━━━━━
COLOR SETTINGS
━━━━━━━━━━━━━━━━━━━━━━
◆ Profile Colors
These settings customize the colors of the visual profile:
• Buy Color
• Sell Color
• Neutral Color
• Profile Opacity
These settings control the appearance of Volume Profile, Bubble Chart, and TPO elements.
◆ POC Colors
These settings customize the colors of current and past POC levels:
• POC Color
• Past POC Color
• POC Opacity
Using different colors for current POCs and past POCs makes the chart easier to read.
━━━━━━━━━━━━━━━━━━━━━━
WHO IS THIS INDICATOR FOR?
━━━━━━━━━━━━━━━━━━━━━━
This indicator is designed for:
◆ cTrader users
◆ Volume Profile traders
◆ TPO traders
◆ Bubble Chart users
◆ POC traders
◆ Algo traders
◆ cBot developers
◆ Traders who want visual tools and robot-ready outputs
◆ Traders who want to test Break and Retest logic around volume zones
━━━━━━━━━━━━━━━━━━━━━━
IMPORTANT NOTE
━━━━━━━━━━━━━━━━━━━━━━
This indicator is not a magic button.
It does not predict the market.
It helps traders identify important market zones, observe price reactions, and build strategies that can be tested, optimized, and automated.
Always test your strategy before using it live.
━━━━━━━━━━━━━━━━━━━━━━
THE QUANT
━━━━━━━━━━━━━━━━━━━━━━
The Quant is a trading and algo trading project focused on:
◆ Data
◆ Automation
◆ Backtesting
◆ Optimization
◆ Anti-overfitting
The goal is to help traders move from ideas to testable, structured, and automatable strategies.
The Quant, for data believers.
Сводка
Designed for both manual traders and algorithmic developers, it supports cBot automation by providing break and retest signals of current and past POC levels, along with scoring to indicate the relative position of these zones to the candle open price. This facilitates the creation and testing of volume-based trading strategies.
Volume calculation can be set to simple tick counts or weighted by price movement size (TickXSize), enhancing the detection of impactful volume zones, especially in CFD markets where volume data is broker-dependent. The indicator offers customizable display modes, filtering parameters for volume zone strength and isolation, and color settings for clarity.
Intended for cTrader users interested in volume profile, TPO, bubble chart visualization, and automated trading strategies, it aids in identifying significant volume zones and price reactions without predicting market direction.
Отзывы покупателей
5 | 100 % | |
4 | 0 % | |
3 | 0 % | |
2 | 0 % | |
1 | 0 % |


