
Deskripsi
## 📊 Apa itu Support & Resistance Breaks?
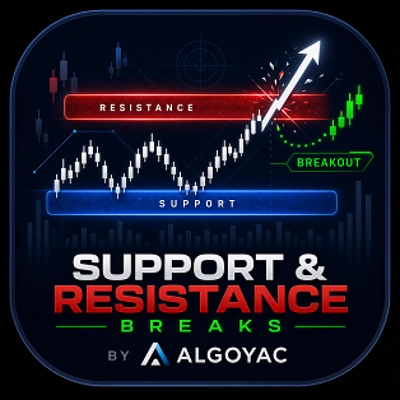
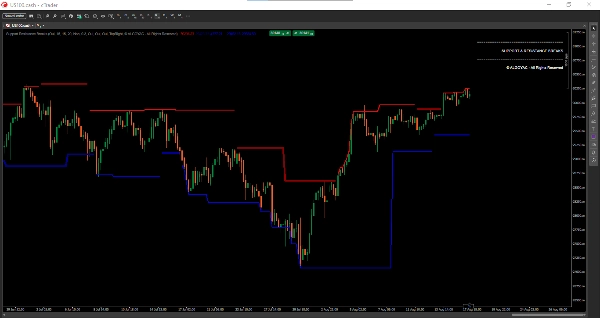
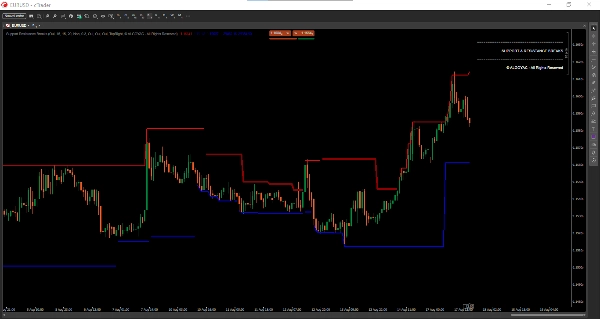
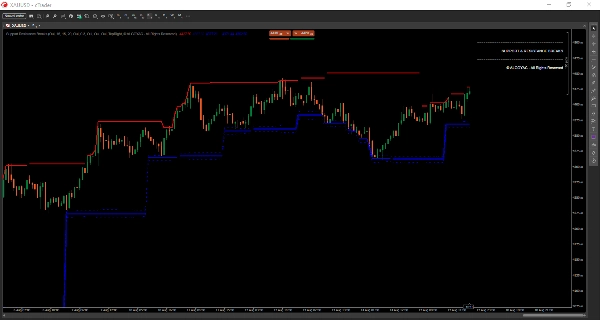
Support & Resistance Breaks adalah indikator deteksi tingkat profesional yang mengidentifikasi level harga kunci secara real-time dan memberi peringatan kepada trader tentang peluang breakout dengan probabilitas tinggi. Berbeda dengan indikator tradisional yang tertinggal, alat ini mendeteksi zona support dan resistance saat terbentuk, memungkinkan trader bereaksi cepat terhadap pergerakan pasar.
Indikator ini menggabungkan analisis pivot point dengan konfirmasi volume dan sistem penilaian canggih untuk menyoroti hanya level yang paling signifikan.
## 🎯 Fitur Utama
### 1. Deteksi Level Real-Time
- **Tanpa Lag** : Level terdeteksi saat terbentuk, bukan setelahnya
- **Pembaruan Dinamis** : Support dan resistance menyesuaikan dengan kondisi pasar yang berubah
- **Penyesuaian Otomatis** : Level diperbarui berdasarkan aksi harga
### 2. Penilaian Kekuatan Level
Setiap level menerima skor kekuatan (0-100%) berdasarkan:
- **Jumlah Sentuhan** (40%) : Berapa kali harga menguji level tersebut
- **Volume di Level** (30%) : Aktivitas perdagangan di dekat level
- **Penolakan Candle** (20%) : Kualitas penolakan harga
- **Kesegaran Level** (10%) : Seberapa baru level tersebut terbentuk
Level kuat (>60%) ditampilkan dengan garis yang lebih tebal:
- **Merah Tua/Biru** : Level kuat (probabilitas tinggi)
- **Merah Muda/Biru Muda** : Level standar (probabilitas sedang)
### 3. Zona Support/Resistance
- **Ukuran Zona yang Dapat Disesuaikan** : Berdasarkan pengali ATR
- **Zona Visual** : Garis putus-putus yang menunjukkan lebar zona penuh
- **Representasi Realistis** : Zona mencerminkan perilaku pasar sebenarnya lebih baik daripada garis tunggal
### 4. Penilaian Kualitas Breakout
Setiap sinyal breakout mencakup skor kualitas (0-100%) berdasarkan:
- **Konfirmasi Volume** (30%) : Lonjakan volume saat breakout
- **Ukuran Badan Candle** (25%) : Kekuatan candle breakout
- **Posisi Penutupan** (25%) : Di mana harga ditutup relatif terhadap rentang
- **Kekuatan Level** (20%) : Pentingnya level yang ditembus
**Warna Kualitas :**
- **Lime** : Breakout kualitas tinggi (>70%)
- **Kuning** : Kualitas sedang (40-70%)
- **Oranye** : Kualitas rendah (<40%)
### 5. Sinyal Breakout
- **Label "B"** : Breakout dengan konfirmasi volume
- **"Bull Wick"** : Penolakan bullish pada support
- **"Bear Wick"** : Penolakan bearish pada resistance
## 📈 Cara Menginterpretasikan Sinyal
### Konfirmasi Breakout
Breakout berkualitas tinggi (label "B" warna lime) dengan volume kuat menunjukkan breakout yang nyata. Breakout berkualitas rendah (oranye) mungkin sinyal palsu.
### Pengujian Level
Saat harga berulang kali menguji level (sentuhan berulang), level tersebut menjadi lebih kuat. Level kuat lebih mungkin bertahan atau menyebabkan pembalikan signifikan.
### Perdagangan Zona
Alih-alih berdagang pada level tepat, gunakan zona. Masuklah dekat batas zona, bukan di tengah.
### Analisis Volume
Osilator volume (EMA 5 vs EMA 10) membantu mengonfirmasi validitas breakout. Breakout dengan volume > ambang batas lebih dapat diandalkan.
## ⚙️ Pengaturan & Parameter
### Grup Pivot Points
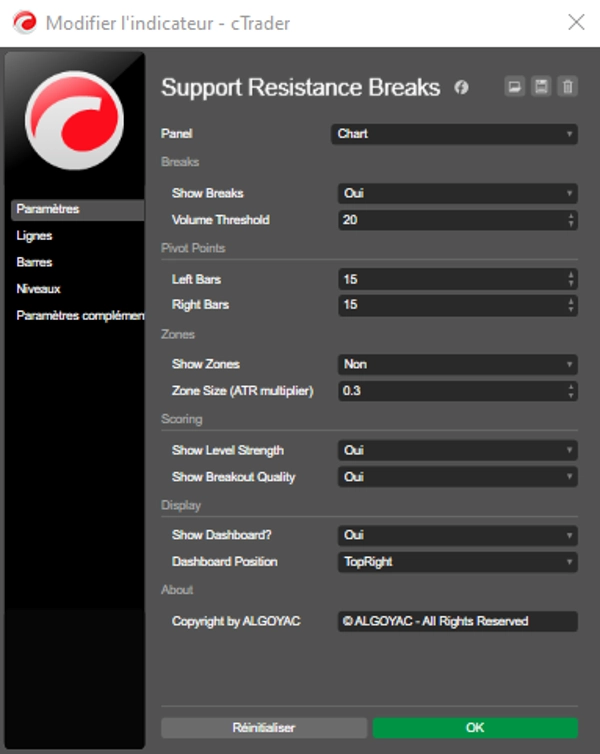
- **Left Bars** (default: 15) : Jumlah bar di kiri untuk deteksi pivot
- **Right Bars** (default: 15) : Jumlah bar di kanan untuk konfirmasi pivot
### Grup Breaks
- **Show Breaks** (default: true) : Tampilkan sinyal breakout
- **Volume Threshold** (default: 20) : Nilai minimum osilator volume untuk breakout valid
### Grup Zones
- **Show Zones** (default: true) : Tampilkan zona support/resistance
- **Zone Size** (default: 0.3) : Lebar zona sebagai pengali ATR
### Grup Scoring
- **Show Level Strength** (default: true) : Tampilkan level kuat vs lemah
- **Show Breakout Quality** (default: true) : Tampilkan skor kualitas pada breakout
## 💼 Kasus Penggunaan Umum
### Day Trading
- Gunakan pada timeframe M15-H1
- Masuk pada breakout berkualitas tinggi (label lime)
- Pasang stop di luar batas zona
- Ambil profit di level support/resistance berikutnya
### Swing Trading
- Gunakan pada timeframe H4-D1
- Fokus pada level kuat (>60% kekuatan)
- Tunggu harga mencapai zona sebelum masuk
- Gunakan kualitas breakout untuk konfirmasi
### Scalping
- Gunakan pada timeframe M1-M5
- Perdagangkan pantulan dari level kuat
- Masuk/keluar cepat di batas zona
- Konfirmasi volume sangat penting
## 👥 Untuk Siapa Indikator Ini?
### Cocok untuk:
- **Trader Level** : Mengidentifikasi dan berdagang pada level kunci
- **Trader Breakout** : Menangkap breakout nyata dengan konfirmasi kualitas
- **Trader Range** : Berdagang di antara zona support dan resistance
- **Trader Volume** : Menggunakan analisis volume untuk konfirmasi
### Tingkat Pengalaman:
- **Pemula** : Level dan sinyal visual yang jelas
- **Menengah** : Gunakan penilaian untuk entri yang lebih baik
- **Lanjutan** : Gabungkan dengan analisis multi-timeframe
## ⚠️ Catatan & Batasan Penting
1. **Breakout Palsu** : Tidak semua breakout berhasil. Gunakan skor kualitas dan konfirmasi volume.
2. **Redundansi Level** : Terlalu banyak level di pasar yang volatil. Sesuaikan Left/Right Bars sesuai kebutuhan.
3. **Lebar Zona** : Zona bisa lebar di pasar dengan ATR tinggi. Sesuaikan parameter Zone Size.
4. **Tidak Mandiri** : Terbaik digunakan bersama indikator lain (momentum, analisis tren).
5. **Kondisi Pasar** : Bekerja terbaik di pasar yang trending. Pasar ranging mungkin menghasilkan banyak sinyal palsu.
## 🔧 Pengaturan yang Direkomendasikan
| Jenis Pasar | Left Bars | Right Bars | Zone Size |
|-------------|-----------|------------|-----------|
| Forex | 15 | 15 | 0.3 |
| Saham | 20 | 10 | 0.2 |
| Crypto | 25 | 15 | 0.5 |
| Indeks | 15 | 10 | 0.3 |
## 🚀 Memulai
1. Tambahkan indikator ke grafik Anda
2. Amati level awal dan kekuatannya
3. Tunggu harga mendekati level kuat
4. Perhatikan sinyal breakout dengan skor kualitas
5. Masuk pada breakout berkualitas tinggi (>70%)
6. Gunakan zona untuk penempatan stop loss
---
Ringkasan
The indicator displays configurable support and resistance zones using ATR multipliers, providing a realistic market representation beyond single lines. Breakout signals include quality scores derived from volume surges, candle body size, close position, and level strength, with color-coded quality indicators (lime for high, yellow for moderate, orange for low).
Breakout signals are labeled ("B" for volume-confirmed breakouts, "Bull Wick" for bullish rejections, and "Bear Wick" for bearish rejections). Volume oscillators assist in confirming breakout validity. Settings allow customization of pivot detection bars, zone size, and display options.
Suitable for various trading styles—including day trading, swing trading, and scalping—this indicator supports multiple timeframes and markets such as Forex, stocks, crypto, and indices. It is intended for traders of all experience levels seeking to identify and trade key levels, breakouts, and ranges with volume-based confirmation.
Diskusi
Ulasan pelanggan
5 | 50 % | |
4 | 50 % | |
3 | 0 % | |
2 | 0 % | |
1 | 0 % |