
Indikator Zona Donchian Lanjutan untuk cTrader
Kuasi Tren Pasar & Breakout dengan Presisi!
Bawa trading Anda ke tingkat berikutnya dengan Indikator Zona Donchian Lanjutan – alat yang kuat dirancang untuk trader yang mengutamakan akurasi, fleksibilitas, dan efisiensi. Indikator generasi berikut ini meningkatkan Saluran Donchian klasik dengan memperkenalkan analisis multi-timeframe, perhitungan harga yang dapat disesuaikan, peringatan waktu nyata, dan visualisasi awan.
Apakah Anda trading forex, saham, atau komoditas, Indikator Zona Donchian Lanjutan membekali Anda dengan alat untuk mengidentifikasi breakout, mengikuti tren, dan trading pembalikan seperti profesional.
Fitur & Manfaat Utama:
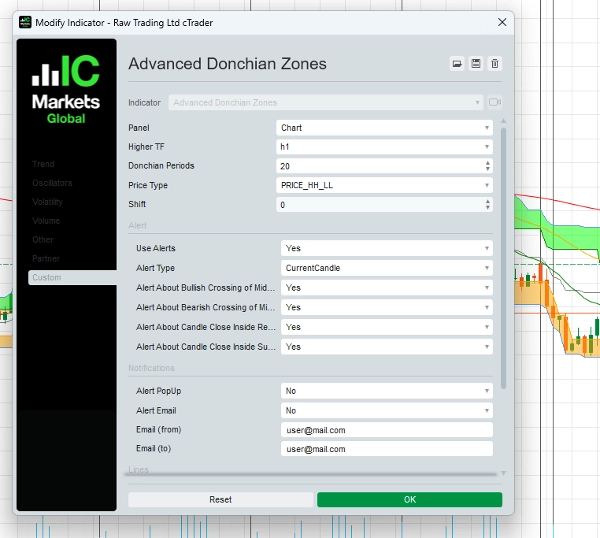
1. Zona Donchian Multi-Timeframe
- Analisis Zona Donchian dari timeframe yang lebih tinggi saat trading di timeframe yang lebih rendah, memastikan Anda selalu selaras dengan tren pasar yang lebih besar.
- Ideal untuk day trader dan swing trader yang ingin mengoptimalkan entri dan keluar mereka.
2. Perhitungan Harga yang Dapat Disesuaikan
- Pilih dari lima tipe harga lanjutan untuk menyempurnakan strategi Anda:
-
- Tertinggi Tinggi / Terendah Rendah
- Rata-rata dari Tinggi/Buka atau Tinggi/Tutup
- Buka Tertinggi / Buka Terendah
- Tutup Tertinggi / Tutup Terendah
- Sesuaikan indikator agar cocok dengan gaya trading dan manajemen risiko Anda.
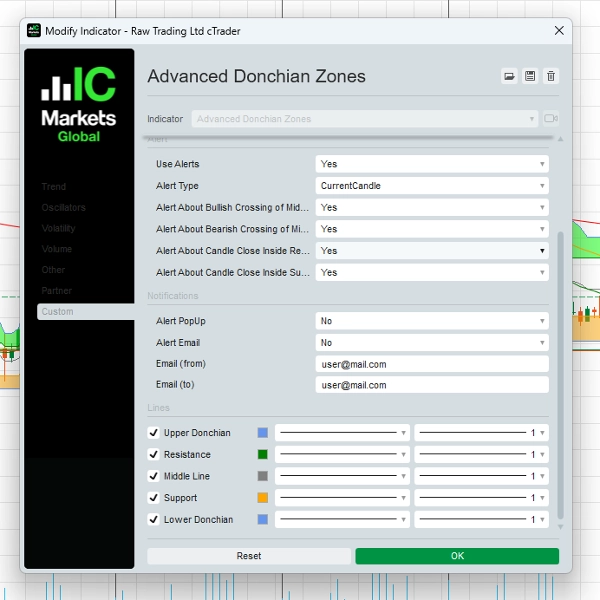
3. Peringatan Dinamis – Jangan Pernah Lewatkan Kesempatan!
- Dapatkan notifikasi waktu nyata saat peristiwa trading penting terjadi:
-
- Persilangan Garis Tengah (sinyal Bullish atau Bearish)
- Harga Menutup di Dalam Zona Kunci (zona potensi pembalikan atau breakout)
- Peringatan tersedia melalui pop-up dan email, menjaga Anda tetap di depan pergerakan pasar.
4. Visualisasi Awan untuk Wawasan yang Jelas
- Zona berbayang unik antara level Donchian membantu trader secara visual mengidentifikasi dukungan, resistensi, dan area breakout dengan cepat dan efektif.
5. Parameter Pergeseran Fleksibel
- Sesuaikan posisi Zona Donchian maju atau mundur dalam waktu untuk menyempurnakan strategi trading Anda.
6. Antarmuka yang Mudah Digunakan
- Dirancang untuk trader dari semua level, dengan tata letak intuitif dan pengaturan yang dapat disesuaikan sesuai preferensi trading Anda.
Cara Menggunakan Indikator Zona Donchian Lanjutan
1. Strategi Trading Breakout – Tangkap Pergerakan Eksplosif!
- Persiapan:
-
- Terapkan Indikator Zona Donchian Lanjutan ke grafik Anda.
- Pilih periode Donchian (misalnya, 20) dan timeframe yang lebih tinggi (misalnya, 1H atau 4H) untuk sinyal yang lebih akurat.
- Entri:
-
- Beli (Go Long) saat harga menembus dan menutup di atas Zona Donchian atas.
- Jual (Go Short) saat harga menembus dan menutup di bawah Zona Donchian bawah.
- Keluar:
-
- Gunakan garis tengah atau Zona Donchian yang berlawanan sebagai level keluar Anda.
- Contoh:
-
- Jika trading pada grafik 15 menit, atur perhitungan Donchian berdasarkan timeframe 1 jam. Saat harga menembus level Donchian atas, masuk posisi beli dengan stop-loss dekat garis tengah.
2. Strategi Mengikuti Tren – Ikuti Momentum Pasar
- Persiapan:
-
- Gunakan garis tengah sebagai filter tren.
- Trading hanya dalam arah tren yang sedang berlangsung.
- Entri:
-
- Beli (Go Long) saat harga di atas garis tengah dan memantul dari zona dukungan.
- Jual (Go Short) saat harga di bawah garis tengah dan memantul dari zona resistensi.
- Keluar:
-
- Tutup posisi saat harga menyeberangi garis tengah ke arah berlawanan.
- Contoh:
-
- Pada grafik 4 jam, harga tetap di atas garis tengah, mengonfirmasi tren naik. Masuk posisi beli saat harga mundur ke zona dukungan dan menunjukkan tanda-tanda pembalikan.
3. Strategi Trading Range-Bound – Dapatkan Keuntungan di Pasar Sampingan
- Persiapan:
-
- Identifikasi periode saat harga berfluktuasi antara Zona Donchian atas dan bawah.
- Entri:
-
- Beli (Go Long) saat harga mendekati dukungan.
- Jual (Go Short) saat harga mendekati resistensi.
- Keluar:
-
- Ambil keuntungan dekat Zona Donchian yang berlawanan atau saat terjadi breakout.
- Contoh:
-
- Pada grafik 1 jam, jika harga berosilasi antara level Donchian atas dan bawah, lakukan trading pada ekstrem ini untuk peluang mean-reversion.
Mengapa Trader Memilih Zona Donchian Lanjutan
✔ Serbaguna untuk Berbagai Gaya Trading – Cocok untuk breakout, mengikuti tren, dan trading range.
✔ Meningkatkan Presisi Trading – Identifikasi level dukungan & resistensi utama dengan akurat.
✔ Peringatan Waktu Nyata – Tetap terinformasi dengan notifikasi instan.
✔ Alat Profesional – Dikembangkan untuk trader yang mencari keunggulan di pasar.
Harga & Penawaran Eksklusif
Harga Khusus Terbatas: $97 (Pembayaran Sekali)
Termasuk:
- Indikator Zona Donchian Lanjutan untuk cTrader
- Panduan Pengguna Lengkap dengan strategi langkah demi langkah
- Pembaruan Gratis selama 1 Tahun
- Dukungan Email Prioritas
Apa Kata Trader
“Saya telah menggunakan Saluran Donchian selama bertahun-tahun, tetapi indikator ini membawa ke level lain. Fitur multi-timeframe benar-benar mengubah permainan!”
— Mark S., Trader Forex
“Peringatan dan pengaturan harga yang dapat disesuaikan membantu saya menangkap trading breakout dengan lebih percaya diri. Sangat direkomendasikan untuk trader serius.”
— Lisa T., Swing Trader
Mulai Hari Ini!
Siap mengubah trading Anda? Klik tombol di bawah untuk membeli Indikator Zona Donchian Lanjutan dan mulai trading dengan presisi!
[Beli Sekarang seharga $97]
Jaminan Uang Kembali 30 Hari
Kami percaya pada produk kami. Jika Anda tidak sepenuhnya puas, hubungi kami dalam 30 hari untuk pengembalian dana penuh – tanpa pertanyaan.
Butuh Bantuan? Hubungi Kami!
📧 Email: o.elmottaqy@gmail.com
🌐 Situs Web: https://t.me/mottaqyo
Peringatan Risiko
Trading melibatkan risiko. Indikator Zona Donchian Lanjutan adalah alat untuk membantu keputusan trading Anda tetapi tidak menjamin keuntungan. Selalu gunakan manajemen risiko yang tepat dan trading dengan bertanggung jawab.
5 | 50 % | |
4 | 50 % | |
3 | 0 % | |
2 | 0 % | |
1 | 0 % |


![Logo "[CB] Pivot Points Pro"](https://cdn.ctrader.com/image/webp/43463c82-67b0-4f10-a4ba-901bba091d81_32594)


