Deskripsi
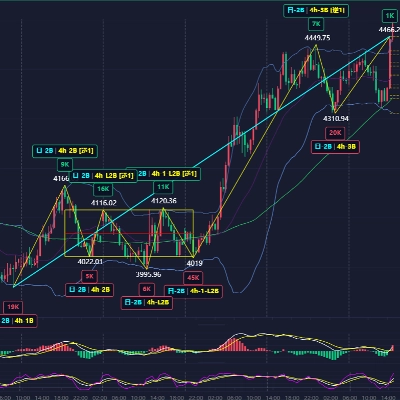
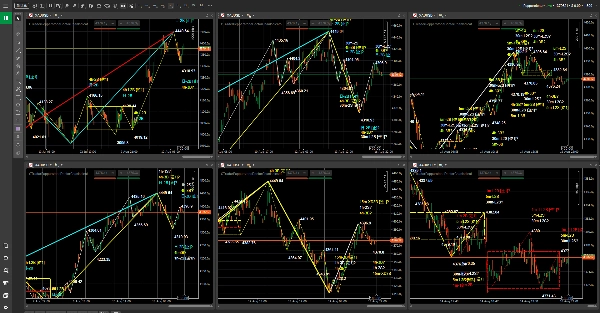
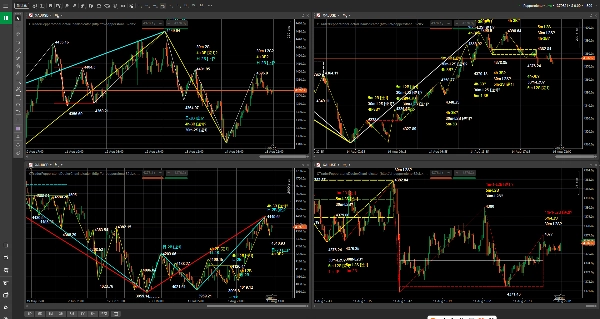
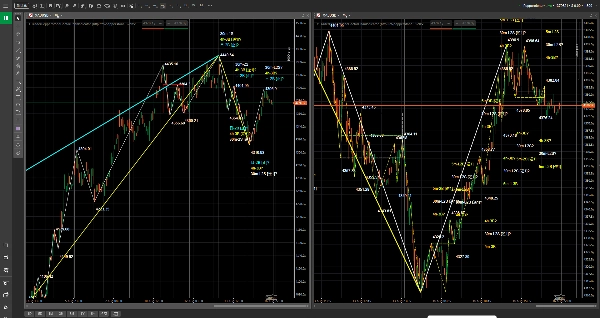
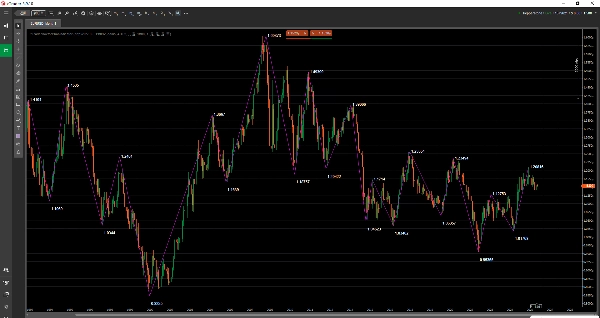
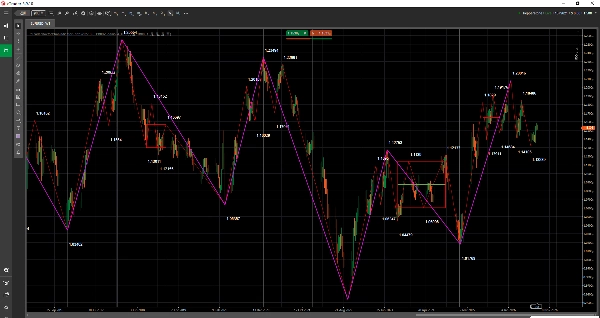
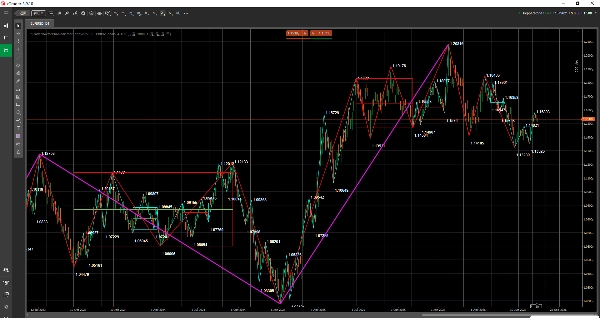
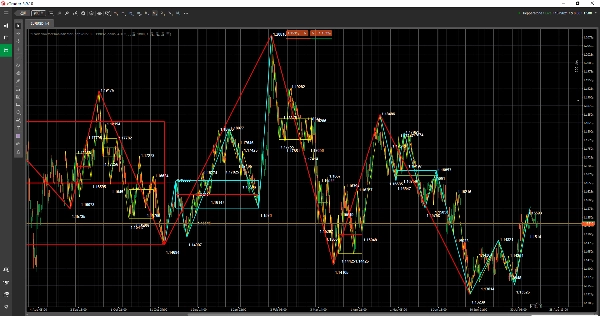
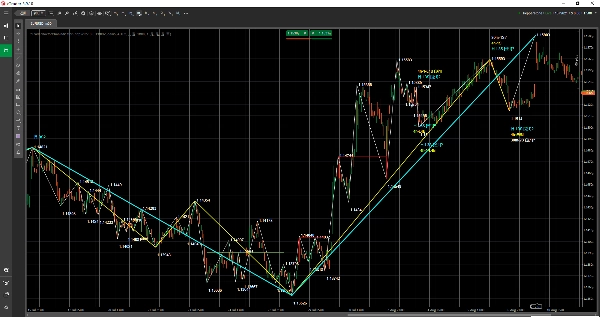
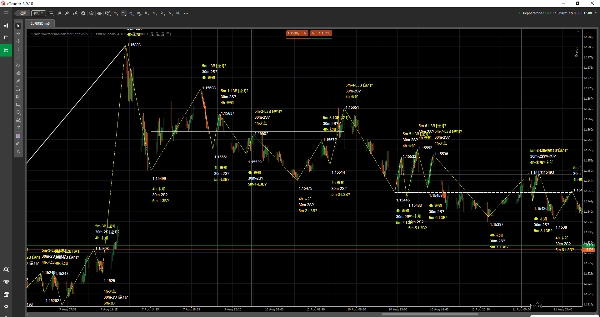
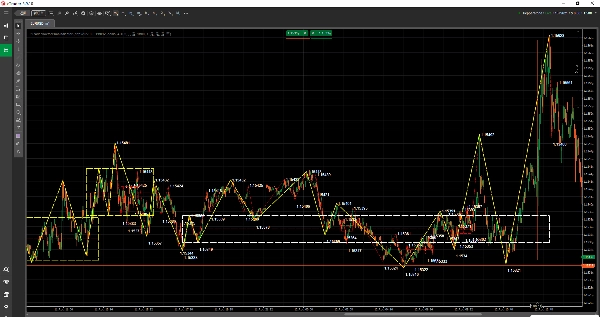
Indikator Teori Dr Chan untuk cTrader adalah indikator analisis teknikal overlay struktur pasar / grafik yang digunakan untuk menampilkan struktur Teori Dr Chan pada grafik cTrader.
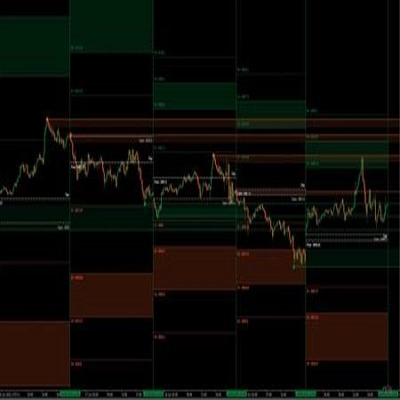
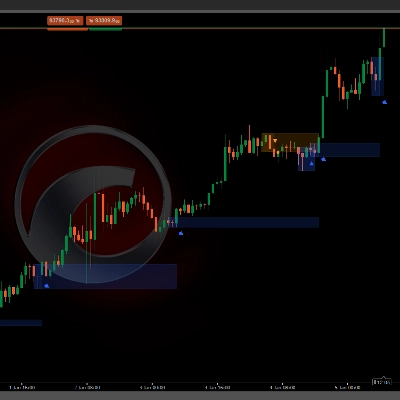
Ini cocok untuk trader yang fokus pada aksi harga, struktur tren, dan analisis multi-timeframe. Indikator ini menampilkan struktur kunci Teori Dr Chan sebagai objek grafik, termasuk struktur Bi, zona Zhongshu, penanda beli/jual, dan lainnya, membantu pengguna mengamati ritme pasar, perubahan struktural, dan hubungan antar timeframe yang berbeda dengan lebih intuitif.
Indikator ini bukan robot trading otomatis dan bukan layanan sinyal trading. Tujuannya adalah membantu pengguna membaca grafik, meninjau pasar, dan membangun rencana trading dengan lebih jelas.
Versi saat ini kompatibel dengan simbol dan timeframe cTrader Pepperstone yang ditentukan. Produk ini adalah indikator pihak ketiga independen dan bukan produk resmi Pepperstone atau produk mitra Pepperstone.
Ikhtisar indikator
- Jenis indikator: indikator struktur pasar / overlay grafik.
- Instrumen yang disukai: simbol Forex, indeks, komoditas, cryptocurrency, dan CFD saham tertentu di Pepperstone cTrader.
- Timeframe yang disukai: 1 menit, 5 menit, 15 menit, 30 menit, 1 jam, 4 jam, harian, mingguan, dan bulanan.
- Kasus penggunaan trading: pengamatan struktur grafik, analisis multi-timeframe, persiapan dan dukungan tinjauan rencana trading.
Apa yang dapat Anda lihat di grafik
- Struktur Bi: digunakan untuk mengamati ritme ayunan dan perkembangan struktur.
- Zona Zhongshu: digunakan untuk mengamati area konsolidasi penting, keseimbangan, dan tumpang tindih struktur.
- Penanda beli/jual: digunakan untuk membantu menemukan titik referensi struktur kunci.
- Label teks, garis horizontal, garis vertikal, area persegi panjang, garis tren, dan objek grafik lainnya.
- Pencocokan data otomatis dengan timeframe grafik saat ini didukung secara default, memudahkan pengamatan multi-timeframe.
Untuk siapa indikator ini
- Pengguna yang sedang belajar atau menggunakan Teori Dr Chan dan analisis struktur Teori Chan.
- Pengguna yang ingin melihat informasi struktur langsung di grafik cTrader.
- Pengguna yang menggunakan Pepperstone untuk melihat Forex, indeks, komoditas, cryptocurrency, atau CFD saham.
- Trader yang perlu membandingkan struktur tren di berbagai timeframe.
- Pengguna yang ingin membuat alur kerja membaca grafik, perencanaan, dan tinjauan menjadi lebih jelas.
Akses dan lisensi
Akses produk dan lisensi dikelola melalui proses pembelian, uji coba, dan instalasi di cTrader Store. Silakan merujuk pada status pembelian, status uji coba, dan informasi produk yang ditampilkan di halaman produk cTrader Store.
Simbol Pepperstone yang didukung saat ini
Forex:
GBPUSD, EURUSD, USDJPY, USDCHF, AUDUSD, USDCAD, GBPJPY
Indeks:
US500, NAS100, GER40, UK100, JPN225, VIX, HSTECH
Komoditas:
XAUUSD, XAGUSD
Cryptocurrency:
BTCUSD, ETHUSD
Saham:
AAPL.US-24, MSFT.US-24, GOOG.US-24, AMZN.US-24, TSLA.US-24, NVDA.US-24, META.US-24, NFLX.US-24, JPM.US-24
Timeframe yang didukung
1 menit, 5 menit, 15 menit, 30 menit, 1 jam, 4 jam, harian, mingguan, dan bulanan.
Alur kerja yang disarankan
1. Buka grafik untuk simbol yang didukung di lingkungan Pepperstone cTrader.
2. Muat Indikator Teori Dr Chan ke grafik.
3. Waktu data Indikator Teori Dr Chan adalah UTC+0. Saat memeriksa struktur grafik, pastikan untuk mengubah zona waktu grafik cTrader ke zona waktu yang sesuai sebelum membandingkan posisi.
4. Pastikan timeframe grafik saat ini didukung. Indikator secara otomatis mencocokkan data dengan timeframe grafik.
5. Nyalakan atau matikan "Tampilkan Bi", "Tampilkan Zhongshu", dan "Tampilkan Beli/Jual" sesuai kebutuhan.
6. Amati struktur grafik bersama dengan rencana trading, manajemen posisi, dan pengendalian risiko Anda sendiri.
Pengaturan parameter
Versi saat ini hanya menampilkan 3 parameter yang terlihat berikut di panel indikator cTrader. Timeframe data, sufiks simbol broker, cache, refresh, transfer terkompresi, dan pengaturan logging dikelola secara internal oleh indikator dan tidak perlu dikonfigurasi untuk penggunaan normal.
Tampilkan Bi
Nilai default: "true"
Apakah akan menampilkan struktur Bi.
Tampilkan Zhongshu
Nilai default: "true"
Apakah akan menampilkan zona Zhongshu.
Tampilkan Beli/Jual
Nilai default: "true"
Apakah akan menampilkan penanda beli/jual.
Catatan penting
- Produk ini adalah indikator asisten analisis teknikal, bukan robot trading otomatis.
- Indikator tidak melakukan pemesanan secara otomatis.
- Indikator tidak merupakan nasihat investasi, layanan sinyal trading, atau jaminan keuntungan.
- Versi saat ini hanya kompatibel dengan simbol cTrader Pepperstone tertentu dan timeframe tertentu.
- Waktu data Indikator Teori Dr Chan adalah UTC+0. Saat menampilkannya di grafik cTrader, harap ubah ke zona waktu grafik yang sesuai sebelum memeriksa posisi struktur.
- Pengguna harus menggunakannya bersama dengan rencana trading, manajemen posisi, pengendalian risiko, dan penilaian independen mereka sendiri.
Arah pembaruan di masa depan
Versi rilis saat ini memprioritaskan simbol dan timeframe cTrader Pepperstone tertentu. Pembaruan di masa depan mungkin akan terus memperluas lebih banyak broker, pemetaan simbol lebih banyak, dan cakupan layanan data yang lebih lengkap sesuai dengan rencana produk.
Peringatan risiko
Perdagangan pasar keuangan melibatkan risiko. Kinerja masa lalu tidak menjamin hasil di masa depan. Indikator ini hanya alat bantu analisis teknikal dan pembelajaran. Ini tidak merupakan nasihat investasi, layanan sinyal trading, atau jaminan keuntungan. Struktur historis tidak mewakili hasil masa depan. Pengguna harus mengujinya secara menyeluruh di lingkungan trading mereka sendiri dan menggunakannya dengan hati-hati bersama aturan manajemen risiko.






![Logo "Smart Money Concepts (SMC) [Iridio Capital]"](https://cdn.ctrader.com/image/webp/b4b5414d-a5ca-44b7-a947-e28eca44a218_61548)