
Deskripsi
Pembalikan 3-Bar
📊 APA ITU?
The 3-Bar Reversal adalah indikator teknikal yang mengidentifikasi pola pembalikan spesifik yang dibentuk oleh tepat tiga lilin berturut-turut. Pola klasik ini menandakan potensi perubahan arah harga melalui struktur visual yang jelas: lilin tren, lilin kelelahan, dan lilin pembalikan.
🎯 APA GUNANYA?
Indikator ini membantu trader untuk:
- Mendeteksi pembalikan bullish dan bearish dengan struktur 3-lilin
- Menyaring sinyal palsu melalui konfirmasi tren yang dapat dikonfigurasi
- Mengidentifikasi zona support dan resistance berdasarkan pola yang terkonfirmasi
- Memvisualisasikan peluang trading dengan penanda grafik yang intuitif
- Melakukan trading pembalikan dengan probabilitas tinggi pada timeframe apa pun
🔍 BAGAIMANA CARA KERJANYA?
Pola Bullish (Pembalikan Bullish 3-Bar)
Struktur tiga lilin:
- Lilin 1 (Bearish): Penutupan di bawah pembukaan - mengonfirmasi tekanan jual
- Lilin 2 (Bearish kelelahan): Membuat titik terendah baru DAN titik tertinggi baru di bawah lilin 1, dengan penutupan bearish - sinyal kapitulasai ⚠️
- Lilin 3 (Pembalikan bullish): Penutupan di atas pembukaan DAN tertinggi di atas tertinggi lilin 1 - mengonfirmasi pergeseran kontrol ✅
Pola Bearish (Pembalikan Bearish 3-Bar)
Struktur sebaliknya:
- Lilin 1 (Bullish): Penutupan di atas pembukaan - mengonfirmasi tekanan beli
- Lilin 2 (Bullish perpanjangan): Membuat titik tertinggi baru DAN titik terendah baru di atas lilin 1, dengan penutupan bullish - sinyal overextension ⚠️
- Lilin 3 (Pembalikan bearish): Penutupan di bawah pembukaan DAN terendah di bawah terendah lilin 1 - mengonfirmasi pergeseran kontrol ✅
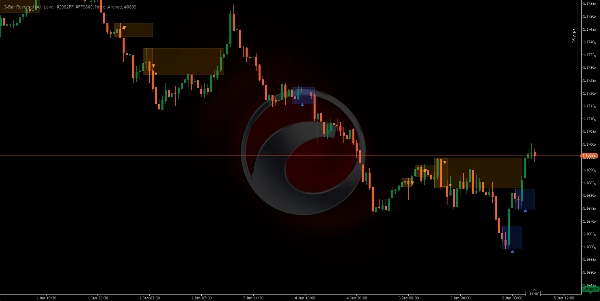
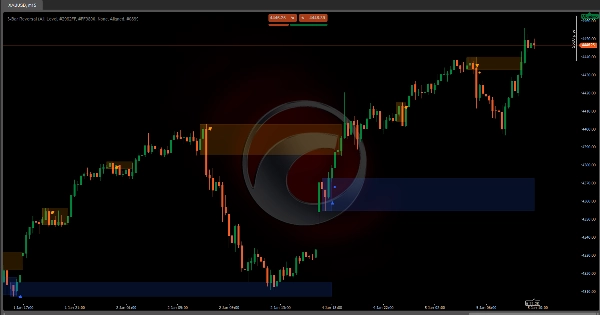
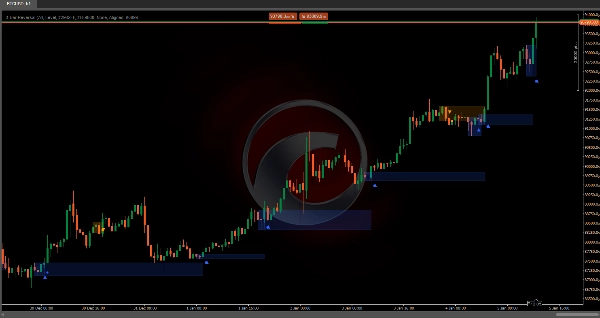
Sistem Manajemen Visual (Mesin Status)
Indikator memproses setiap pola dalam tiga fase berurutan:
FASE 1 - DETEKSI POLA: 🔍
- Struktur lengkap 3-lilin diidentifikasi
- Sebuah indikator segitiga (▲ bullish / ▼ bearish) muncul pada lilin ketiga
- Sebuah persegi panjang setup semi-transparan digambar menutupi:
-
- Bullish: Dari tertinggi lilin 1 ke titik terendah terendah (lilin 2 atau 3)
- Bearish: Dari terendah lilin 1 ke titik tertinggi tertinggi (lilin 2 atau 3)
- Persegi panjang ini menandai "zona pertempuran" tempat pembalikan terjadi
FASE 2 - KONFIRMASI ATAU INVALIDASI: ⏳
Sistem menunggu lilin berikutnya setelah pola untuk memvalidasinya:
Konfirmasi Bullish: ✅
- Penutupan lilin berikutnya harus melebihi tertinggi lilin 1 (langit-langit persegi panjang)
- Sebuah titik padat (●) muncul menandai konfirmasi
- Persegi panjang menjadi zona support aktif
Konfirmasi Bearish: ✅
- Penutupan lilin berikutnya harus menembus terendah lilin 1 (lantai persegi panjang)
- Sebuah titik padat (●) muncul menandai konfirmasi
- Persegi panjang menjadi zona resistance aktif
Invalidasi: ❌
- Bullish gagal jika: penutupan di bawah minimum persegi panjang ATAU pola bearish muncul
- Bearish gagal jika: penutupan di atas maksimum persegi panjang ATAU pola bullish muncul
- Persegi panjang berhenti meluas (pola mati)
Perpanjangan Menunggu: ⏸️
- Jika tidak ada konfirmasi atau kegagalan, persegi panjang diperpanjang secara horizontal lilin demi lilin
FASE 3 - ZONA SUPPORT/RESISTANCE AKTIF: 🎯
- Setelah dikonfirmasi, zona diperpanjang tanpa batas ke kanan
- Zona bullish: Tetap aktif selama harga berada di atas lantai
- Zona bearish: Tetap aktif selama harga berada di bawah langit-langit
- Zona dinonaktifkan ketika harga benar-benar menembusnya ke arah berlawanan
⚙️ KONFIGURASI UTAMA
Mode Pola
Mengontrol variasi pola mana yang diterima:
- Normal: Hanya menerima ketika lilin 3 menutup DI DALAM rentang lilin 1
-
- Bullish: Penutupan < tertinggi lilin 1 (pembalikan moderat)
- Bearish: Penutupan > terendah lilin 1 (pembalikan moderat)
- Ditingkatkan: Hanya menerima ketika lilin 3 menutup DI LUAR rentang lilin 1 🔥
-
- Bullish: Penutupan > tertinggi lilin 1 (pembalikan eksplosif)
- Bearish: Penutupan < terendah lilin 1 (pembalikan eksplosif)
- Semua (Direkomendasikan): Menerima kedua tipe tanpa pembeda ⭐
Tipe Support/Resistance
- Level: Fungsi garis dasar (terbatas dalam versi ini)
- Zona: Menggambar persegi panjang berbayang menandai zona SR setelah konfirmasi 📦
- Tidak Ada: Tidak ada zona SR, hanya menampilkan pola yang terdeteksi
Warna yang Dapat Disesuaikan 🎨
- Warna Pembalikan Bullish: Untuk segitiga, persegi panjang dan zona bullish (default:
#2962FF- biru) - Warna Pembalikan Bearish: Untuk segitiga, persegi panjang dan zona bearish (default:
#FF9800- oranye) - Warna Tren Bullish: Untuk visualisasi filter tren (default:
#089981- hijau) - Warna Tren Bearish: Untuk visualisasi filter tren (default:
#F23645- merah)
🔧 FILTER TREN
Indikator dapat menyaring pola berdasarkan arah tren keseluruhan menggunakan empat metode:
1. Awan Moving Average ☁️
Menggunakan dua moving average untuk mengidentifikasi tren:
Parameter:
- Tipe Moving Average: Simple, Exponential, Hull, Weighted, dll. (default: Hull)
- Periode Cepat: 50 (default)
- Periode Lambat: 200 (default)
Logika Filter (Sejajar):
- Tren bullish terdeteksi ketika: Harga > MA Cepat DAN MA Cepat > MA Lambat ✅
- Tren bearish terdeteksi ketika: Harga < MA Cepat DAN MA Cepat < MA Lambat ✅
- Hanya menampilkan pola bullish dalam tren bullish dan pola bearish dalam tren bearish
Logika Kebalikan (Berlawanan):
- Membalikkan kondisi untuk menangkap pembalikan kontra-tren utama
2. Supertrend 📈
Indikator mengikuti tren berbasis volatilitas (ATR):
Parameter:
- Periode ATR: 10 (default) - jendela perhitungan volatilitas
- Faktor Pengali: 3.0 (default) - sensitivitas indikator
Logika:
- Menghitung pita atas dan bawah menggunakan ATR
- Harga di atas Supertrend = tren bullish 🟢
- Harga di bawah Supertrend = tren bearish 🔴
- Menyaring pola sesuai penyelarasan yang dikonfigurasi
3. Saluran Donchian 📊
Menggunakan ekstrem harga selama periode tertentu:
Parameter:
- Panjang Saluran: 13 (default)
Logika:
- Saluran atas = tertinggi tertinggi dari N periode
- Saluran bawah = terendah terendah dari N periode
- Titik tengah = (atas + bawah) / 2
- Harga di atas titik tengah = tren bullish 🟢
- Harga di bawah titik tengah = tren bearish 🔴
4. Tidak Ada (Tanpa Filter) 🔓
Menampilkan SEMUA pola 3-bar yang terdeteksi tanpa mempertimbangkan tren keseluruhan. Berguna untuk:
- Pasar yang bergerak dalam rentang terbatas
- Analisis pola murni
- Trading pembalikan dalam konteks apa pun
Penyelarasan Tren
Berlaku saat filter aktif:
- Sejajar: Hanya menampilkan pola yang SEIRING dengan tren yang teridentifikasi ➡️
-
- Hanya pola bullish dalam tren bullish
- Hanya pola bearish dalam tren bearish
- Berlawanan: Hanya menampilkan pola yang MELAWAN tren yang teridentifikasi 🔄
-
- Pola bullish dalam tren bearish (pembalikan besar)
- Pola bearish dalam tren bullish (pembalikan besar)
Ringkasan
It operates in three phases: pattern detection, confirmation or invalidation based on the next candle's behavior, and establishing active support or resistance zones that extend while price respects them. The indicator supports configurable pattern modes (Normal, Enhanced, or All) to control acceptance criteria for reversals.
Trend filtering is available through four methods—Moving Average Cloud, Supertrend, Donchian Channels, or no filter—allowing users to align pattern signals with overall market trends or capture counter-trend reversals. Confirmed reversal zones are displayed as shaded rectangles or levels, customizable in color for bullish and bearish signals, trend filters, and zones.
This tool is designed for use on any timeframe and across various markets, including forex pairs (EURUSD, GBPUSD, USDJPY, NZDUSD), commodities (XAUUSD), indices (NAS100), and cryptocurrencies (BTCUSD). It aids traders in detecting high-probability reversals, filtering false signals, and identifying support and resistance zones with clear visual markers.


