present
Inscrivez-vous et bénéficiez d'une remise de 50 $ sur votre premier achat
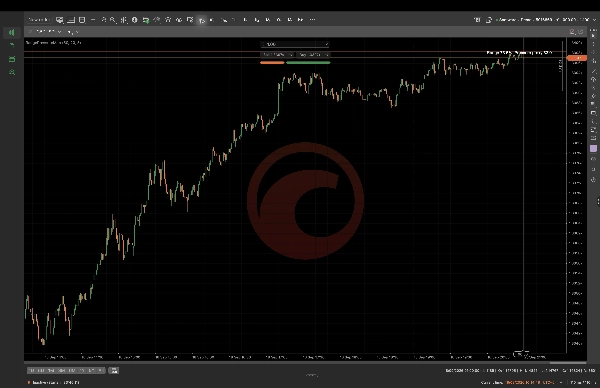
Trading product for Range Pressure Map Indicateur EMA Volume, image 1
Range Pressure Map
Indicateur
Version 1.0, Sep 2026
Windows, Mac
5.0
Avis : 2
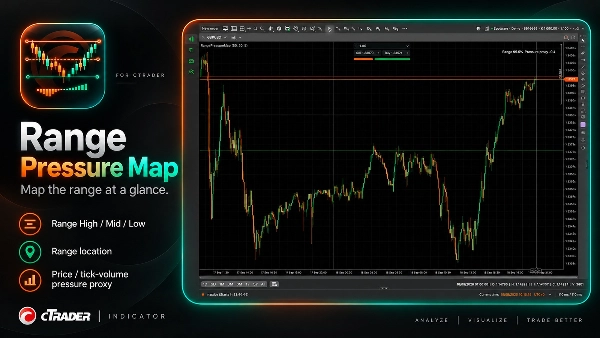
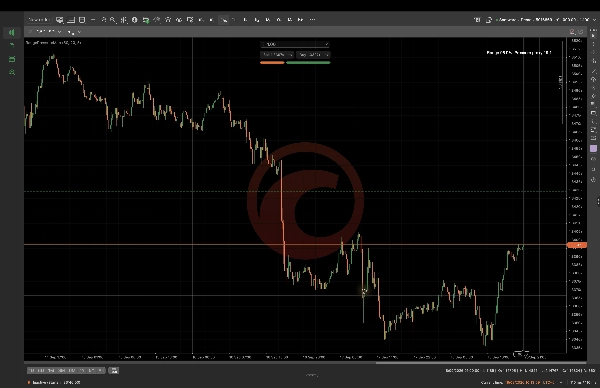
Trading product for Range Pressure Map Indicateur EMA Volume, image 2
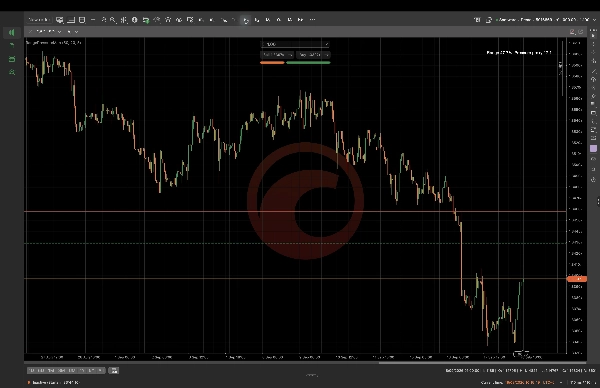
Trading product for Range Pressure Map Indicateur EMA Volume, image 3
Trading product for Range Pressure Map Indicateur EMA Volume, image 4
Trading product for Range Pressure Map Indicateur EMA Volume, image 5
Depuis le 16/09/2026

Description

La carte de pression de la plage calcule une plage de retour en arrière et affiche la plage haute, la plage moyenne et la plage basse ainsi que la position actuelle du prix et un proxy de pression de volume de tick déterministe. Configurez la plage de retour en arrière, la plage de pression et la longueur de l'EMA pour correspondre au contexte du graphique que vous examinez. Il est conçu pour une analyse discrétionnaire des graphiques et ne représente pas le flux d'ordres, le volume réel du marché, l'activité des acheteurs ou des vendeurs, les prévisions ou l'exécution automatique des transactions. Les valeurs dépendent du symbole sélectionné, de l'intervalle de temps, des paramètres et des données disponibles.

Résumé

Résumé IA
Range Pressure Map is a cTrader indicator that calculates a lookback range and visually displays the Range High, Range Mid, and Range Low levels on your chart. It also shows the current price location within this range alongside a deterministic tick-volume pressure proxy, which serves as an estimate of market pressure based on tick volume data. Users can customize parameters including range lookback period, pressure lookback, and EMA length to align with their specific chart context. This tool is intended for discretionary chart analysis and does not provide order flow data, real market volume, buyer or seller activity, predictive signals, or automated trade execution. Its outputs depend on the selected trading symbol, timeframe, and input parameters. The indicator supports visualization of support and resistance levels combined with volume-based pressure insights to assist traders in analyzing price action within defined ranges.
Profil de l'indicateur
Catégorie de l'indicateur
Assistance et résistance
Type de résultat
Visualisation
Exigences en matière de données
Barres seulement

Discussion

Avis clients

5.0
Avis : 2
5
100 %
4
0 %
3
0 %
2
0 %
1
0 %
Avis clients
October 20, 2026
Range Pressure Map provided a clean and consistent range view on EURUSD and XAUUSD across H1 and M1. High, Mid and Low levels were clearly plotted, while the displayed range percentage matched the visible price location well. The pressure proxy added context without cluttering the chart or being presented as true order flow. Score 4,7/5
October 7, 2026
A range high, midpoint and low put the pressure proxy in a clear setting. Lookback and EMA controls make the view adjustable, and the description is upfront about using tick volume rather than real buyer and seller flow. That honesty makes the map easier to interpret.

Questions fréquentes

EMA
Volume
Les produits disponibles sur cTrader Store, notamment les bots de trading, les indicateurs et les plug-ins, sont fournis par des développeurs tiers et mis à disposition à titre informatif et à des fins d'accès technique uniquement. cTrader Store n'est pas un courtier et ne fournit aucun conseil en investissement, aucune recommandation personnelle ni aucune garantie quant aux performances futures.

Plus de cet auteur

Indicateur
BOS
MSS
+4
See confirmed BOS, CHOCH and SWEEP structure events on your cTrader chart.
Indicateur
BOS
Add standard-timeframe context candles to a native Renko chart.
Indicateur
Channel
Key Levels
+1
Monitor a selected chart trendline and confirm breaks on candle close.
Plug-in desktop
Trade Journal
Trade Statistics
Review daily PnL, trade counts, losing streaks and rapid re-entry from your cTrader history.
Plug-in desktop
Chart UI Tools
Keep lines, zones and channels synced across selected same-symbol charts from one desktop plugin.
cBot
Drawdown Guard
Daily Loss Limit
Monitor account-wide loss and stop-loss risk budgets, with optional order cancellation and post-fill closure.
Plug-in desktop
Position Sizer
Risk Calculator
Size manual trades from your risk settings and review Market, Limit or Stop orders before execution.
Indicateur
Volume
Key Levels
View tick activity across a selected chart range with Point of Control, Value Area High and Value Area Low.

Vous pourriez aussi aimer

Indicateur
Area of Interest with the power of AI to detect the market interest.
Indicateur
Prop
Forex
+3
Price Change Bundle 3-in-1 Levels • Bars • Histogram. Secret of Price Change
Indicateur
ATR
BOS
+5
Market structure with BOS and CHoCH, order blocks, and retest buy/sell arrows with entry, stop and two targets
Indicateur
ATR
MACD
+15
MACD Advanced -- It combines the standard MACD logic with a rich set of visual tools
Indicateur
VWAP
Volume
+5
Multi VWAP. Three timeframes. One clean chart. Your Essential Trading Tool.
Indicateur
Forex
BTCUSD
+5
Multi-timeframe moving averages with session lines for structured trend analysis directly on the chart.
Indicateur
Market Structure
Support & Resistance
Auto-centers price when it moves beyond threshold. Adjustable zoom. Works on any chart type. Never lose price again.
Logo de "E7 BBKG Indicator"
Les mieux notés
4.5
(4)
$25
/
$50
Indicateur
Prop
E7 BBKG indicator with 80% plus accuracy used to show both, possible reversal and trend.
Indicateur
Forex
Crypto
+6
The cTrader Chaos Reversals indicator brings high-quality reversal signals to traders.
Indicateur
Risk Dashboard
AI-powered daily range forecasts help traders spot volatility opportunities and plan stops and targets.
Indicateur
Order Block
Fair Value Gap
+1
This indicator contains most of the ICT strategies that you need. You can turn on/off each one to be shown.
Logo de "Zigzag Trend"
Les mieux notés
4.5
(4)
$25
/
$45
Indicateur
AI
ATR
+23
The ZigZag Trend is a market structure tool that filters out small price fluctuations and highlights major swing.
Indicateur
Volume
Key Levels
+1
Order book indicator .Don't trade against the flow. Trade with the truth!
Indicateur
AI
ATR
+20
“Dynamic Swing VWAP — Structure-Anchored, Volatility-Adaptive, Market-Ready.” 🚀
Indicateur
SMC
Forex
+5
ICT liquidity engine for Gold: maps stop clusters, scores zones & projects the next target. Now with 4 ICT killzones.
Logo de "CVD Ai"
Populaire
4.0
(2)
$35
/
$49
Indicateur
AI
ATR
+5
"Advanced VSA & CVD indicator with 'A+ Setup' filtering based on Support & Resistance levels."
Indicateur
ATR
SMC
+17
Adaptive Swing-Anchored VWAP that tracks market structure shifts with precision and clarity.
Indicateur
ATR
Volume
+3
Volume profile key levels - POC, value area, volume peaks and troughs - with break, rejection and retest signals

Prix

Depuis le 16/09/2026