present
Registrieren Sie sich und erhalten Sie $50 Rabatt auf Ihren ersten Kauf
Trading product for BheureksoPattern Indikator Engulfing EMA, image 1
BheureksoPattern
Indikator
Version 1.0, Sep 2026
Windows, Mac
Trading product for BheureksoPattern Indikator Engulfing EMA, image 2
Trading product for BheureksoPattern Indikator Engulfing EMA, image 3
Trading product for BheureksoPattern Indikator Engulfing EMA, image 4
Trading product for BheureksoPattern Indikator Engulfing EMA, image 5
Trading product for BheureksoPattern Indikator Engulfing EMA, image 6

Beschreibung

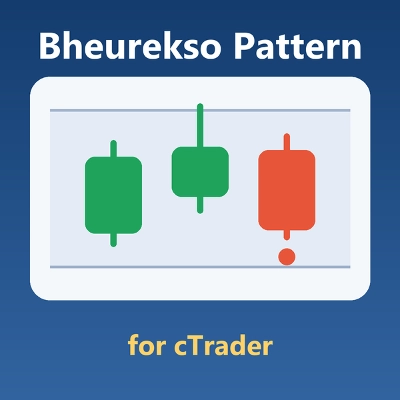
Most candlestick patterns are noise. An engulfing bar in the middle of nowhere tells you very little. Bheurekso Pattern treats every pattern as a candidate and waits for price to prove it.

How a signal fires

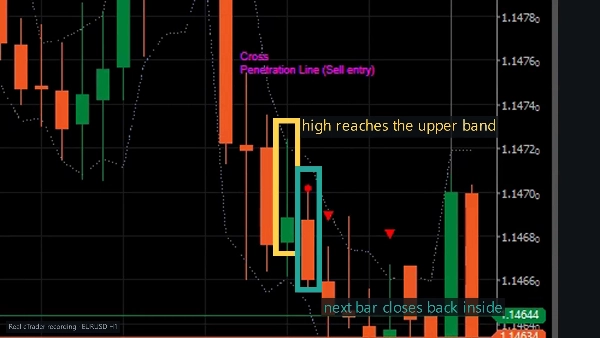
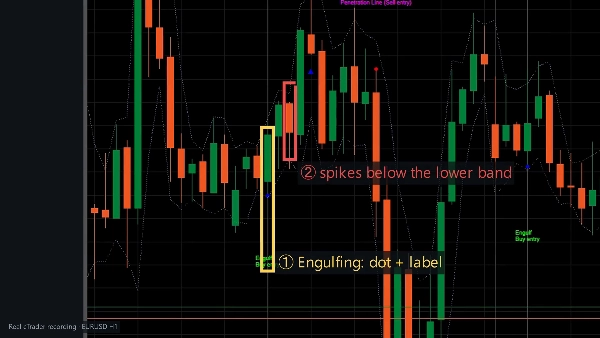
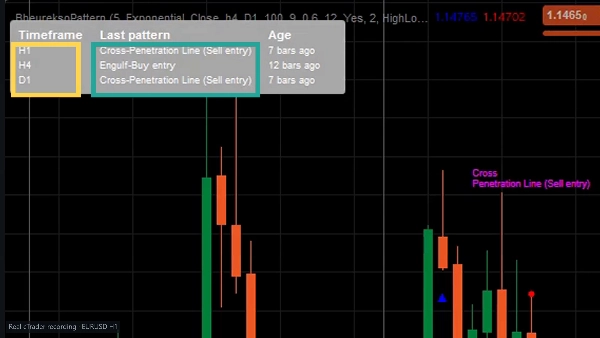
A pattern (Engulfing, Penetration Line and ten more) is marked with a dot and a label. It becomes a buy or sell arrow only when, within five bars, one bar reaches the edge of the Donchian channel and the next bar closes back inside it. Most patterns never get that rejection, so most never get an arrow.

What it draws

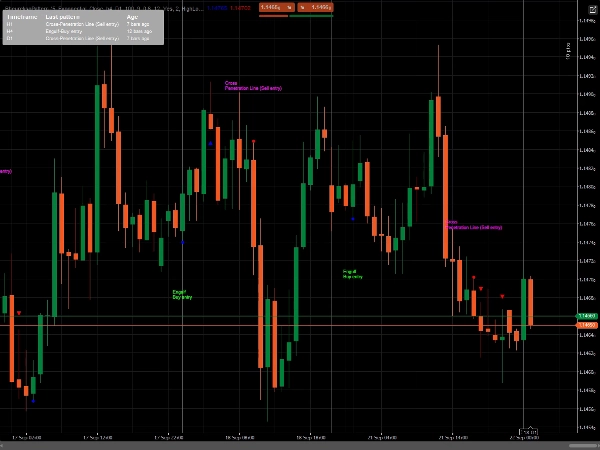
  • A dot and a two-line label on the pattern bar
  • A buy or sell arrow once the rejection lands
  • An optional Donchian channel
  • A dashboard with the last confirmed pattern on your chart timeframe and two higher timeframes you choose (H4 and D1 by default)

Settings worth knowing

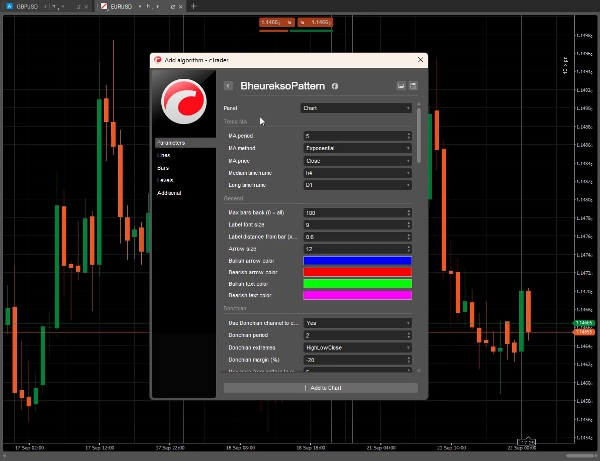
  • Max bars from pattern to signal (default 5): raise it for more arrows, lower it for tighter ones
  • Max bars back (default 100, 0 = the whole history)
  • Twelve pattern switches, three on by default
  • Trend filter: MA period, method and price
  • Donchian period, extremes and margin, or switch the Donchian filter off to see every pattern
  • Every label and alert text is editable, with separate colours for bullish and bearish marks

Alerts: popup, sound or email, with separate switches for pattern alerts and buy/sell signals.

Type, markets and timeframes

Chart overlay indicator for price action and candlestick patterns. It works on any symbol and timeframe. H1 to D1 on liquid forex pairs and gold is where the patterns read best; on M1 to M15 you get many more candidates and more noise, so keep the Donchian filter on there.

How traders use it

  • As a reversal filter: act only on patterns that come with a failed push through the channel edge
  • As confirmation for an entry you already planned from your own levels or trend
  • As a watchlist: the dashboard shows at a glance which of three timeframes printed a confirmed pattern and how many bars ago
  • As an alert source, so you do not have to watch the chart for the next confirmed setup

Requires no special permissions (AccessRights.None).

This is an analysis tool. It places no trades and makes no profitability claim. Trading involves risk.

Zusammenfassung

Indikatorprofil
Indikatorkategorie
Muster
Ausgabetyp
Visualisierung
Signale
Datenanforderungen
Nur Balken
Unterstützte Signale
Wendepunkt

Diskussion

Kundenbewertungen

0.0
Bewertungen: 0
Kundenbewertungen
Bisher gibt es keine Bewertungen für dieses Produkt. Haben Sie es schon ausprobiert? Dann können Sie die erste Person sein, die andere darüber informiert!

Häufig gestellte Fragen (FAQ)

Engulfing
EMA
Donchian Channels
Liquidity Sweep
Moving Average
Über den cTrader Store verfügbare Produkte, einschließlich Handelsbots, Indikatoren und Plugins, werden von externen Entwicklern bereitgestellt und nur zu Informations- und technischen Zugriffszwecken verfügbar gemacht. cTrader Store ist kein Broker und erbringt keine Anlageberatung, persönlichen Empfehlungen oder eine Garantie für zukünftige Performance.

Mehr von diesem Autor

Indikator
MSS
Inducement
+5
ICT Core is a non-repainting Smart Money Concepts indicator

Das könnte Sie auch noch interessieren

Indikator
Key Levels
Trend-filtered signals, transparent trade plans and a multi-timeframe decision panel for cTrader.
Indikator
AI
ATR
+26
Session Volume Profile + Composite. POC/VAH/VAL, Focus/Solo. Fast, clean, no ghosts, live-ready.
Indikator
AI
ATR
+27
VolumeProfileSuite is an advanced and flexible Volume Profile indicator for cTrader.
Indikator
BOS
EMA
+5
VWAP Bands indicator with 3 standard deviation levels, buy/sell zones, and a draggable ON/OFF button to toggle the entir
Indikator
Prop
Forex
+14
🚀See the market’s framework, decide faster. Session-Aware Pivots. Auto Presets. Pro-Grade Zones.🚀
Indikator
Forex
BTCUSD
+5
Auto-plots Open, High, and Low of Day/Week/Month/Year. Session candle counter + Round Numbers. Fully customizable
Indikator
ATR
Key Levels
+1
Explore 88 harmonic price-pattern variants with interactive chart controls and geometric reference levels.
Indikator
SMC
Prop
+5
ADVANCED ICT + ADR + AWR SUITE PRO (The Ultimate All-in-One Toolkit for Price Action Traders)
Indikator
Risk Dashboard
AI-powered daily range forecasts help traders spot volatility opportunities and plan stops and targets.
Indikator
Shows BUY & SELL signals for 3 & 4 BAR PATTERN (Morning star/ Evening star). It is adjustable and it will SHOW ARROWS.
Indikator
RSI
Forex
+10
Unlock Stochastic RSI PRO in cTrader! Overlay RSI, highlight zones, and identify divergences with customizable settings.
Indikator
Forex
EURUSD
+5
With this Fibonacci retracement indicator, traders have full control over the retracement levels displayed on the chart.
Indikator
Key Levels
Liquidity Grab
+2
The levels you mark each morning, drawn and followed: PDH/PDL, weekly, monthly, sessions, equal highs/lows.
Indikator
Forex
BTCUSD
+7
🚀 TMAX RBA Indicator - The Ultimate Multi-Timeframe Momentum System 🚀
Indikator
SMC
Prop
+15
Previous HLOC – Smart Higher-Timeframe Levels for Precision Trading.
Indikator
RSI
VWAP
+5
📈 Anchored VWAP with auto High/Low, session resets, Daily VWAP & TWAP — precise, Pine-accurate port.
Indikator
ATR
Volume
+3
Volume profile key levels - POC, value area, volume peaks and troughs - with break, rejection and retest signals
Indikator
Prop
ZigZag
+5
All-in-One ICT/SMC Institutional Framework — Ranges, Structure, Liquidity, Fibonacci & Time Engine.

Preis