설명
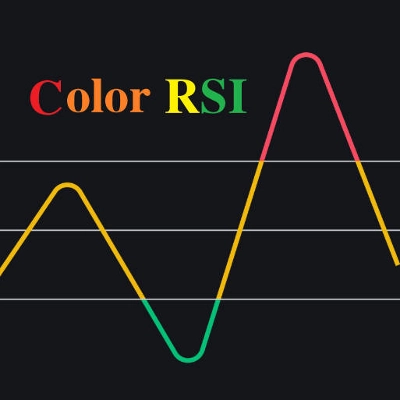
이것은 슈퍼 인디케이터입니다 RSI 인디케이터와 이중 이동 평균 시스템을 통합합니다. RSI 강도는 네 가지 색상으로 표시됩니다: 빨간색 (>70) > 주황색 (>50) > 노란색 (>30) > 녹색. 이중 이동 평균은 기본 매개변수가 48/144로 설정된 EMA를 사용하며, 필요에 따라 사용자 지정할 수 있습니다.
사용 방법:
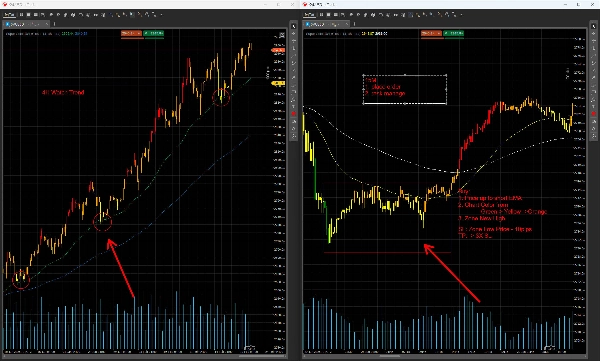
다중 시간 프레임과 함께 사용할 때 (예: 4H→15M; 1H→5M, 여기서는 4H→15M를 예로 설명):
- 이중 EMA를 통한 추세 식별 (4H 타임프레임):
-
- 상승 추세: 48EMA 가 144EMA 위에 있습니다.
- 하락 추세: 48EMA 가 144EMA 아래에 있습니다.
- 횡보 구간: 두 EMA가 얽혀 있습니다.
- 15M 타임프레임에서 진입/청산 포인트:
-
- 매수 설정 (상승 추세):
-
- 가격이 4H 차트의 48EMA로 되돌림합니다.
- 15M로 전환: 가격이 15M 횡보 구간 위로 돌파할 때 진입합니다.
- 손절매: 최근 스윙 고점에 +10 핍 으로 설정합니다.
- 매도 설정 (하락 추세):
-
- 가격이 4H 차트의 48EMA로 되돌림합니다.
- 15M로 전환: 가격이 15M 횡보 구간 아래로 돌파할 때 진입합니다.
- 손절매: 최근 스윙 저점에 –10 핍 으로 설정합니다.
- 가격 다이버전스 신호:
-
- 약세 다이버전스 (상단):
-
- 가격이 새로운 고점을 형성하지만 (되돌림 시), RSI 색상이 빨간색 (RSI >70) 에서 주황색 (RSI >50) 으로 변합니다.
- 강세 다이버전스 (하단):
-
- 가격이 새로운 저점을 형성하지만 (되돌림 시), RSI 색상이 녹색 (RSI ≤30) 에서 노란색 (RSI ≤50) 으로 변합니다.
위험 경고:
모든 시장 상황에 맞는 인디케이터는 없습니다. 이 전략을 실거래에 적용하기 전에 데모 환경에서 충분히 테스트하십시오. 부적절한 사용은 큰 손실을 초래할 수 있습니다.
요약
지표 프로필
고객 리뷰
0.0
리뷰: 0
고객 리뷰
이 상품에 대한 리뷰가 아직 없습니다. 이미 사용해 보셨나요? 다른 사람들에게 가장 먼저 소개해 주세요!
상담
자주 묻는 질문(FAQ)
Prop
Forex
Indices
Commodities
RSI
Crypto
Stocks
트레이딩 봇, 지표, 플러그인 등 cTrader Store에서 제공되는 상품은 제3자 개발자에 의해 제공되며, 이는 단순히 정보 및 기술적 접근을 목적으로 제공된 것입니다. cTrader Store는 중개인이 아니며, 투자 조언, 개인별 추천 또는 향후 성과에 대한 어떠한 보장도 제공하지 않습니다.


가격
가입일 30/09/2024
44
판매