VIX - volatility indicator - Renko
Indikator
Versi 1.0, Feb 2025
Windows, Mac
Deskripsi
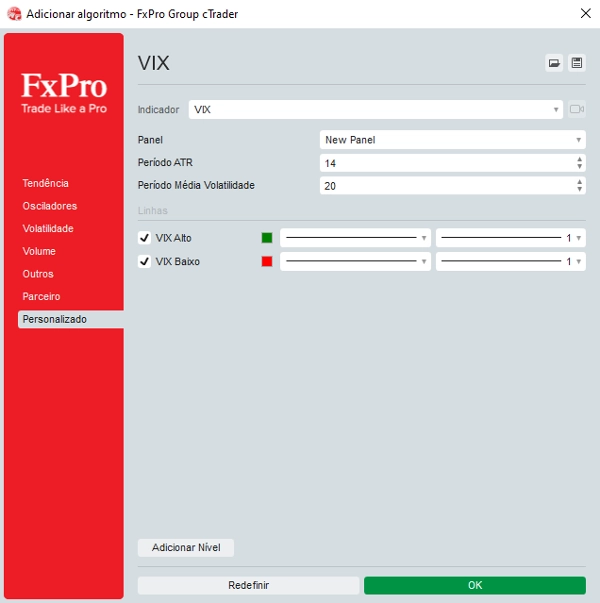
Sesuaikan parameter: Masukkan nilai yang diinginkan untuk level LowLevel dan HighLevel, dan sesuaikan Faktor Skala VIX sehingga garis VIX memiliki tinggi yang diinginkan.
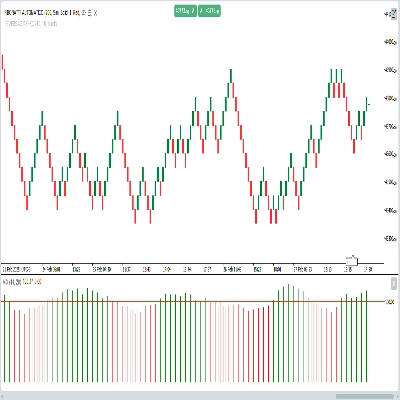
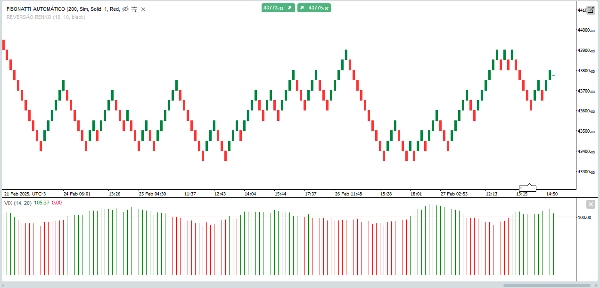
Lihat grafik:
Ketika VIX melewati HighLevel dan volume tinggi (lilin hijau), Anda dapat menganggap bahwa terjadi breakout.
Ketika VIX berada di bawah LowLevel, ini mungkin menunjukkan periode volatilitas rendah.
Ringkasan
Profil indikator
Ulasan pelanggan
0.0
Ulasan: 0
Ulasan pelanggan
Belum ada ulasan untuk produk ini. Sudah mencobanya? Jadilah pemberi ulasan pertama!
Diskusi
Pertanyaan umum
Breakout
Produk-produk yang tersedia melalui cTrader Store, termasuk bot trading, indikator, dan plugin, disediakan oleh pengembang pihak ketiga serta hanya ditujukan untuk akses teknis dan informasi. cTrader Store bukan broker dan tidak menyediakan saran investasi, rekomendasi pribadi, atau jaminan apa pun tentang kinerja di masa mendatang.


Harga
Sejak 05/02/2025
30
Penjualan