Deskripsi
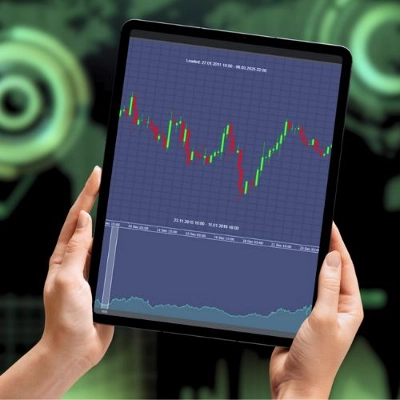
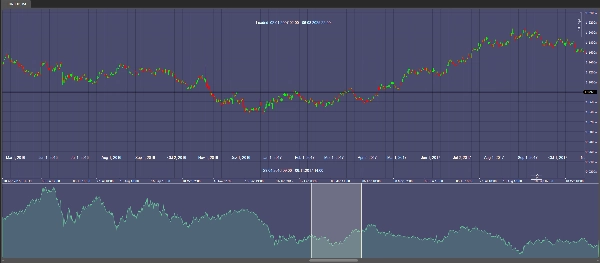
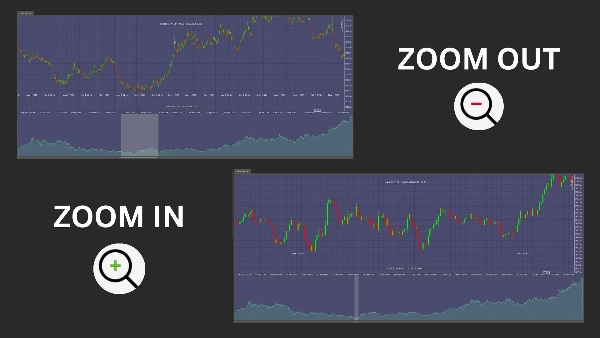
ChartOverview menjaga Anda tetap sepenuhnya informasi tentang seluruh rentang data pasar, dari titik data paling awal hingga terbaru yang tersedia. Di bagian atas grafik Anda, Anda melihat tampilan jelas dari rentang waktu yang dimuat lengkap, sementara periode yang terlihat saat ini ditampilkan langsung pada grafik untuk wawasan waktu nyata.
Indikator dinamis ini diperbarui secara mulus saat Anda menggulir, menyeret, atau mengubah ukuran grafik Anda, memastikan Anda selalu memiliki informasi terkini. Desain intuitifnya memungkinkan Anda dengan cepat mengidentifikasi tren dan peluang pasar, meningkatkan kemampuan Anda untuk membuat keputusan perdagangan yang tepat waktu dan berdasarkan informasi yang baik.
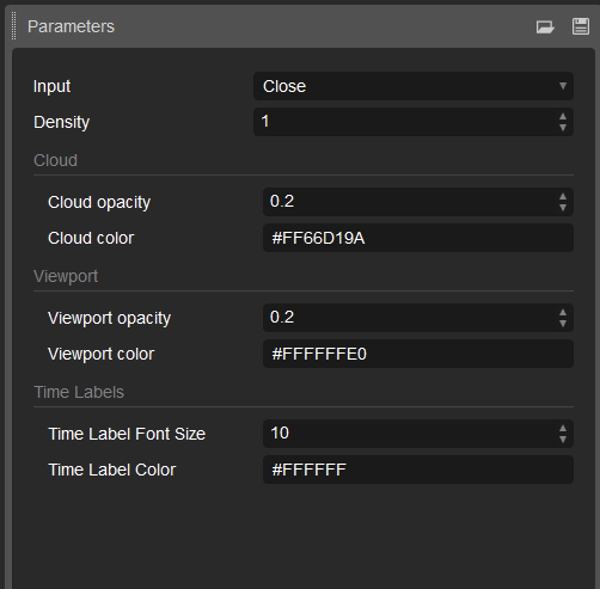
Dengan opsi kustomisasi yang luas untuk warna, opasitas, dan pengaturan tampilan, ChartOverview terintegrasi sempurna ke dalam pengaturan perdagangan pribadi Anda. Perkuat analisis Anda dan dapatkan keunggulan kompetitif dengan alat yang dirancang untuk memberikan gambaran pasar yang tepat dan komprehensif.
Ringkasan
Ulasan pelanggan
5 | 100 % | |
4 | 0 % | |
3 | 0 % | |
2 | 0 % | |
1 | 0 % |