
Deskripsi
Indikator Pola Hammer – Penjelasan Strategi
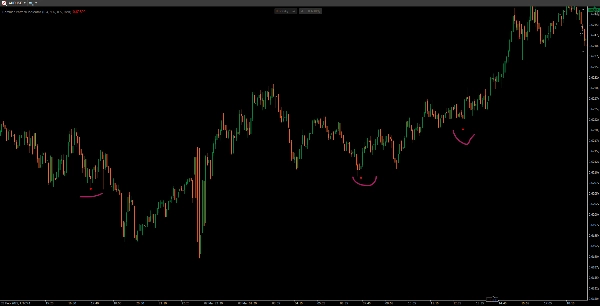
Ini Indikator Pola Hammer adalah sinyal pembalikan berbasis candlestick yang mengidentifikasi pola hammer bullish dalam tren turun. Ini dirancang untuk mendeteksi potensi pembalikan tren dan menyoroti peluang beli.
Cara Kerjanya
1️⃣ Mendeteksi Tren Turun
- Harga penutupan candle harus lebih rendah dari penutupan 3 bar sebelumnya, menandakan potensi tren turun.
2️⃣ Memvalidasi Struktur Candlestick Hammer
- Badan Kecil: Badan candle relatif kecil (≤ 30% dari total rentang).
- Bayangan Bawah Panjang: Sumbu bawah setidaknya 2 kali ukuran badan (menunjukkan penolakan kuat terhadap harga yang lebih rendah).
- Bayangan Atas Pendek: Sumbu atas ≤ 30% dari ukuran badan (menandakan sedikit resistensi di bagian atas).
3️⃣ Menampilkan Sinyal Beli
- Jika semua kondisi terpenuhi, sebuah titik merah (atau warna yang dipilih) muncul sedikit di bawah harga terendah candle hammer sebagai konfirmasi visual dari potensi pembalikan.
Fitur Utama
✅ Menyaring sinyal lemah dengan memastikan adanya tren turun sebelumnya.
✅ Parameter yang dapat disesuaikan untuk ukuran badan, panjang bayangan, dan warna.
✅ Pola candlestick yang sederhana namun efektif untuk trader swing dan trader aksi harga.
📌 Penggunaan Terbaik: Konfirmasi pola hammer dengan indikator tambahan (misalnya, volume, level support) untuk sinyal yang lebih kuat! 🚀
Ringkasan
Ulasan pelanggan
5 | 100 % | |
4 | 0 % | |
3 | 0 % | |
2 | 0 % | |
1 | 0 % |


