![Trading product for [Stellar Strategies] Market Structure Breakout Indikator Signal Breakout, image 1](https://cdn.ctrader.com/image/webp/bceec265-3247-4b11-915f-6295a29c106d_28465)
![Trading product for [Stellar Strategies] Market Structure Breakout Indikator Signal Breakout, image 2](https://cdn.ctrader.com/image/webp/01ab79aa-faea-416f-a7e8-dac2f6195047_28466)
![Trading product for [Stellar Strategies] Market Structure Breakout Indikator Signal Breakout, image 3](https://cdn.ctrader.com/image/webp/3588f2c0-dd5a-4df4-967c-fe2b4de791f8_28467)
![Trading product for [Stellar Strategies] Market Structure Breakout Indikator Signal Breakout, image 4](https://cdn.ctrader.com/image/webp/c098fda7-69e9-4b38-92b0-1561a798b674_28468)
![Trading product for [Stellar Strategies] Market Structure Breakout Indikator Signal Breakout, image 5](https://cdn.ctrader.com/image/webp/4a442b80-f948-483a-bd0a-8ce3767e6b2e_28469)
Deskripsi
Indikator Breakout Struktur Pasar
Ikhtisar
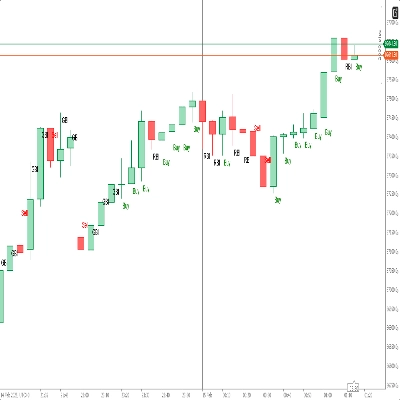
Indikator ini dirancang untuk mengidentifikasi peluang trading potensial dengan mendeteksi breakout dari rentang harga terbaru pada grafik cTrader Anda. Ini secara visual menyoroti ketika harga ditutup secara signifikan di atas harga tertinggi terbaru (potensi kelanjutan/reversal bullish) atau di bawah harga terendah terbaru (potensi kelanjutan/reversal bearish), mengambil inspirasi dari konsep breakout struktur pasar.
Cara Kerja
- Identifikasi Rentang: Untuk setiap bar, indikator melihat kembali selama sejumlah bar sebelumnya yang ditentukan (didefinisikan oleh
Lookback Period). Ini mengidentifikasi harga tertinggi absolut dan harga terendah absolut yang dicapai dalam periode tersebut. - Deteksi Breakout: Ini memeriksa apakah harga penutupan bar saat ini lebih tinggi dari harga tertinggi tertinggi yang ditemukan dalam periode lookback (breakout bullish) atau lebih rendah dari harga terendah terendah (breakout bearish).
- Penyaringan Tren (Opsional): Jika
Enable Trend Filterdiatur ketrue, indikator juga memeriksa harga relatif terhadap Moving Average (Trend MA Period&Trend MA Type). -
- Sinyal breakout bullish hanya dianggap valid jika harga penutupan juga di atas Moving Average.
- Sinyal breakout bearish hanya dianggap valid jika harga penutupan juga di bawah Moving Average. Ini membantu menyaring breakout yang berlawanan dengan tren yang berlaku yang didefinisikan oleh MA.
Elemen Visual
- Panah:
-
- Sebuah Panah Bullish (default LimeGreen) muncul di bawah rendah dari sebuah bar yang ditutup di atas tertinggi tertinggi terbaru (dan memenuhi filter tren, jika diaktifkan).
- Sebuah Panah Bearish (default Merah) muncul di atas tinggi dari sebuah bar yang ditutup di bawah terendah terendah terbaru (dan memenuhi filter tren, jika diaktifkan).
- Jarak panah dari bar secara otomatis disesuaikan berdasarkan volatilitas pasar menggunakan ATR (
Arrow ATR Offset Multiplier).
- Garis Horizontal:
-
- Ketika terjadi breakout bullish, sebuah Garis Resistensi yang Terputus (default Merah) digambar pada level tertinggi tertinggi yang telah ditembus.
- Ketika terjadi breakout bearish, sebuah Garis Support yang Terputus (default LimeGreen) digambar pada level terendah terendah yang telah ditembus.
- Garis-garis ini dimulai dari bar tempat pivot tinggi/rendah terjadi dan memanjang ke depan melewati bar breakout sejumlah bar yang didefinisikan oleh
Line Extension Bars. Ini membantu memvisualisasikan level yang telah ditembus. - Gaya dan ketebalan garis dapat disesuaikan.
- Label (Opsional):
-
- Jika
Label Typetidak diatur keNone, sebuah label teks muncul di dekat ujung garis horizontal yang diperpanjang. - Ini dapat menampilkan level
Priceaktual,Textkustom (seperti "MSB"), atauBoth. - Warna label dapat disesuaikan.
- Jika
- Batas Riwayat: Hanya sejumlah
Max Historical Breakoutssinyal bullish dan bearish terbaru (panah + garis + label) yang ditampilkan untuk menjaga kebersihan grafik. Mengatur ini ke 0 menampilkan semuanya.
Cara Menggunakan & Apa yang Harus Dicari
- Sinyal Masuk: Panah breakout dapat menandakan titik masuk potensial ke arah breakout. Panah bullish menunjukkan kemungkinan masuk posisi long, sedangkan panah bearish menunjukkan kemungkinan masuk posisi short.
- Konfirmasi: Gunakan breakout bersama dengan bentuk analisis lain (misalnya, analisis volume, pola grafik, analisis fundamental) untuk mengonfirmasi sinyal. Jangan hanya mengandalkan indikator ini.
- Support/Resistance: Garis horizontal yang digambar oleh indikator mewakili level harga di mana harga sebelumnya berhenti. Setelah breakout, level ini dapat membalik perannya:
-
- Level resistensi yang ditembus (garis merah) mungkin berfungsi sebagai support potensial di masa depan.
- Level support yang ditembus (garis hijau) mungkin berfungsi sebagai resistensi potensial di masa depan. Perhatikan bagaimana harga berinteraksi dengan garis yang diperpanjang ini pada bar berikutnya.
- Konteks Tren: Mengaktifkan
Trend Filterdapat membantu Anda fokus pada breakout yang sejalan dengan arah pasar yang lebih luas, berpotensi mengurangi trading yang berlawanan dengan tren kuat. - Penyesuaian Parameter: Bereksperimenlah dengan
Lookback Period. Periode yang lebih pendek akan lebih sensitif dan menghasilkan lebih banyak sinyal (potensi lebih berisik). Periode yang lebih panjang akan mengidentifikasi breakout dari rentang yang lebih signifikan tetapi menghasilkan sinyal lebih sedikit. Sesuaikan berdasarkan kerangka waktu dan karakteristik pasar. SesuaikanTrend MA Perioduntuk menentukan tren yang ingin Anda ikuti. - Kerangka Waktu: Indikator bekerja pada kerangka waktu apa pun. Ingat bahwa
Lookback Period20 berarti 20 bar dari kerangka waktu spesifik tersebut.
Peringatan
- Jika
Enable Sound Alertsadalahtrue, indikator akan memutarAlert Sound Fileyang ditentukan saat sinyal breakout baru muncul pada bar real-time terbaru (tidak akan memberi peringatan selama backtesting atau pemuatan riwayat).
Parameter Kunci
Lookback Period: Jumlah bar masa lalu untuk menemukan harga tertinggi/terendah.Enable Trend Filter: Mengaktifkan/mematikan filter Moving Average.Trend MA Period/Type: Pengaturan untuk Moving Average penyaring tren.Max Historical Breakouts: Membatasi berapa banyak sinyal masa lalu yang ditampilkan.Arrow ATR Offset Multiplier: Mengontrol jarak panah dari bar berdasarkan volatilitas.Line Extension Bars: Seberapa jauh garis horizontal memanjang melewati breakout.Label Type/Custom Label Text: Mengontrol tampilan label pada garis.Enable Sound Alerts/Alert Sound File: Mengonfigurasi peringatan audio.- Parameter Warna/Gaya: Sesuaikan tampilan visual.
Penafian: Trading melibatkan risiko. Indikator ini memberikan sinyal teknis berdasarkan perhitungannya, tetapi tidak menjamin keuntungan atau memprediksi masa depan. Selalu gunakan manajemen risiko dan lakukan analisis sendiri sebelum membuat keputusan trading apa pun.
Ringkasan
Visual cues include lime green bullish arrows below bars breaking above highs and red bearish arrows above bars breaking below lows. These arrows are positioned dynamically based on market volatility using the ATR (Average True Range). The indicator also draws horizontal lines at broken support or resistance levels, extending forward to help visualize these key price levels. Labels can be optionally displayed on these lines, showing price, custom text, or both, with customizable colors.
Users can limit the number of historical breakout signals shown to maintain chart clarity. Sound alerts can be enabled to notify when new breakout signals occur in real time. The indicator works on any timeframe, with sensitivity adjustable via the lookback period and trend filter settings. It is intended to assist in identifying entry points and support/resistance levels but should be used alongside other analysis methods.
Ulasan pelanggan
5 | 100 % | |
4 | 0 % | |
3 | 0 % | |
2 | 0 % | |
1 | 0 % |
![Logo "[Stellar Strategies] BOS Trend 1.0"](https://cdn.ctrader.com/image/webp/6cdec0f1-0e97-4a82-a8a4-2b67aed54d38_25695)
![Logo "[Stellar Strategies] Market Session Ultimate"](https://cdn.ctrader.com/image/webp/61ffd537-0125-4246-9e72-42eca1791d64_28232)
![Logo "[Stellar Strategies] Wave Trend Pro"](https://cdn.ctrader.com/image/webp/5f226fbb-245a-41cd-9cdd-b018257d5e6d_28617)
![Logo "[Stellar Strategies] Inside Bar with Signals"](https://cdn.ctrader.com/image/webp/1d9e8bfa-3b2c-4440-bb37-5856902008a7_30683)
![Logo "[Stellar Strategies] Linear Regression Candles 1.1"](https://cdn.ctrader.com/image/webp/8b9cff9f-2431-46d2-b0ec-c7f55f4a4a6d_27918)
![Logo "[Stellar Strategies] Smart ADX"](https://cdn.ctrader.com/image/webp/af13b084-b6f6-41db-b7bc-c7e688b57b05_36929)
![Logo "[StellarStrategies] Scheduled Trade Executor"](https://cdn.ctrader.com/image/webp/daefc6af-7eca-453e-878d-1b981be2c401_25646)
![Logo "[Stellar Strategies] VBO"](https://cdn.ctrader.com/image/webp/f034c012-94d4-445a-a01b-febd1cdedaef_36944)
![Logo "[Stellar Strategies] SP500 Gap Closure cBot 1.0"](https://cdn.ctrader.com/image/webp/92c23fdc-4ad1-4e61-bdb5-c77f6ec8c539_27686)
![Logo "[Stellar Strategies] Candlestick Patterns Dashboard"](https://cdn.ctrader.com/image/webp/ae8691a5-4884-4553-9bcc-64e16ac82a30_38344)
![Logo "[Stellar Strategies] QQE"](https://cdn.ctrader.com/image/webp/e702104a-874c-4b39-97dd-fb34518d1015_27712)
![Logo "[Stellar Strategies] Visual Trend Momentum"](https://cdn.ctrader.com/image/webp/48aee0a5-f10e-4bc8-9671-78e156fcc5df_27548)