Deskripsi
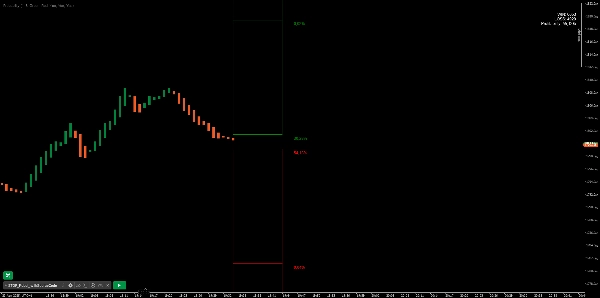
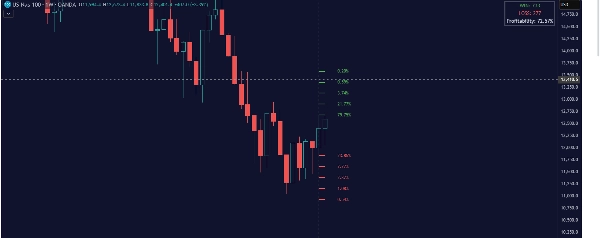
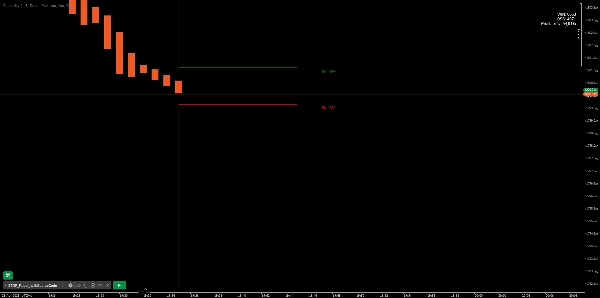
Probabilitas Breakout adalah indikator berharga yang menghitung probabilitas tertinggi atau terendah baru dan menampilkannya sebagai level dengan persentasenya. Probabilitas tertinggi dan terendah baru diuji kembali, dan hasilnya ditampilkan dalam tabel—cara sederhana untuk memahami kemungkinan candle berikutnya mencapai tertinggi atau terendah baru. Selain itu, indikator menampilkan empat level tambahan di atas dan di bawah candle dengan probabilitas mencapai level tersebut.
Indikator ini membantu trader memahami kemungkinan arah candle berikutnya, yang dapat digunakan untuk menetapkan bias trading Anda.
█ Perhitungan
Algoritma menghitung semua candle hijau dan merah secara terpisah tergantung apakah candle sebelumnya merah atau hijau dan memberikan skor jika satu atau lebih garis tercapai. Algoritma kemudian menghitung berapa banyak candle yang mencapai level tersebut dalam sejarah dan menampilkannya sebagai nilai persentase pada setiap garis.
█ Contoh
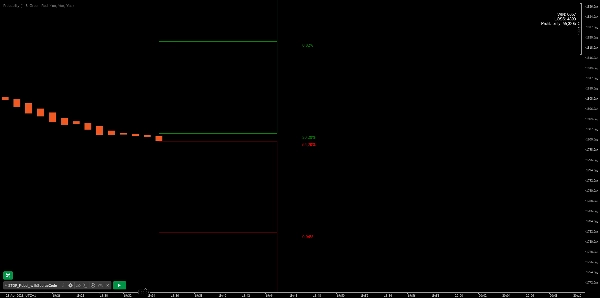
Dalam contoh ini, candlestick sebelumnya berwarna hijau; kita dapat melihat bahwa tertinggi baru telah tercapai 72,82% dari waktu dan terendah hanya 28,29%. Dalam kasus ini, tertinggi baru telah dibuat.
Ringkasan
Ulasan pelanggan
5 | 100 % | |
4 | 0 % | |
3 | 0 % | |
2 | 0 % | |
1 | 0 % |