
คำอธิบาย
เทรนด์วิชวล:
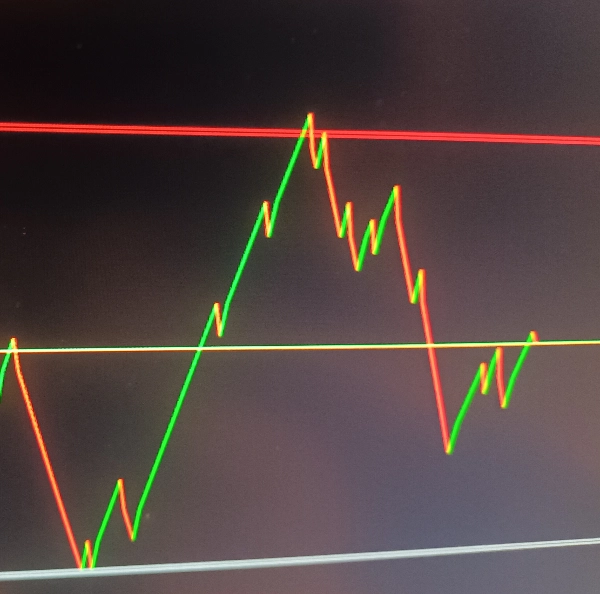
วาดเส้นเทรนด์ (สีเขียวสำหรับแนวโน้มขาขึ้น สีแดงสำหรับแนวโน้มขาลง) ตามการเปลี่ยนแปลงทิศทางราคา
แสดงเส้นราคาสีเหลืองบนกราฟ
โซนแนวรับ/แนวต้าน:
ระดับแนวรับและแนวต้านที่ปรับแต่งได้พร้อมความหนาที่ปรับได้ (เป็นพิป)
สีและความทึบแสงที่กำหนดเองสำหรับโซน
โซนที่โต้ตอบได้ซึ่งสามารถปรับแต่งด้วยตนเองบนกราฟ
ระบบแจ้งเตือน:
แจ้งเตือนการเปลี่ยนแปลงเทรนด์ (เมื่อทิศทางราคามีการเปลี่ยนแปลง)
แจ้งเตือนเมื่อราคาชนโซนแนวรับ/แนวต้าน
เสียงแจ้งเตือนที่กำหนดเองสำหรับเหตุการณ์ต่างๆ
แนวรับ/แนวต้านอัตโนมัติ:
ตัวเลือกการปรับระดับแนวรับ/แนวต้านอัตโนมัติเมื่อเทรนด์เปลี่ยนแปลง
วิธีการทำงาน
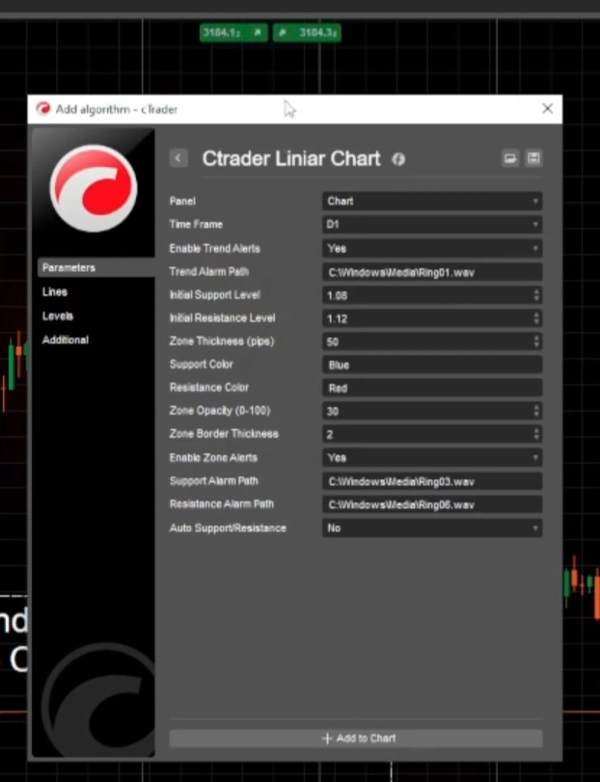
ตั้งค่ากรอบเวลาที่เลือก (ค่าเริ่มต้นคือรายวัน)
ระดับแนวรับ/แนวต้านด้วยค่าปริยายหรือค่าที่ผู้ใช้กำหนด
เริ่มตัวจับเวลาตรวจสอบการปรับโซนเป็นระยะ
ตรรกะการคำนวณ
สำหรับแต่ละแท่งเทียน เปรียบเทียบราคาปิดปัจจุบันกับราคาปิดก่อนหน้า
กำหนดทิศทางเทรนด์ปัจจุบัน (ขึ้น/ลง)
วาดเส้นเทรนด์ระหว่างราคาปัจจุบันและราคาก่อนหน้า
ถ้าทิศทางเทรนด์เปลี่ยนแปลง:
อัปเดตระดับแนวรับ/แนวต้านโดยอัตโนมัติ (ถ้าเลือกใช้)
กระตุ้นการแจ้งเตือนเทรนด์ (ถ้าเปิดใช้งาน)
ตรวจสอบว่าราคาเข้าสู่โซนแนวรับ/แนวต้านและกระตุ้นการแจ้งเตือนตามนั้น
การจัดการโซน
โซนแนวรับ/แนวต้านถูกวาดเป็นสี่เหลี่ยมโปร่งแสง
โซนสามารถปรับแต่งด้วยตนเองบนกราฟและตัวบ่งชี้จะติดตามการเปลี่ยนแปลงเหล่านี้
ความหนาของโซนสามารถปรับได้เป็นพิป
ประเภทการแจ้งเตือน
แจ้งเตือนเทรนด์: กระตุ้นเมื่อราคามีการเปลี่ยนทิศทาง (ขึ้น/ลง)
แจ้งเตือนโซน: กระตุ้นเมื่อราคาเข้าสู่โซนแนวรับ/แนวต้าน
แจ้งเตือนระดับอัตโนมัติ: เมื่อเปิดใช้งานแนวรับ/แนวต้านอัตโนมัติ แจ้งเตือนเมื่อระดับเหล่านี้ถูกปรับโดยอัตโนมัติ
การเลือกกรอบเวลา
เปิด/ปิดใช้งานประเภทการแจ้งเตือนต่างๆ
เส้นทางไฟล์เสียงที่กำหนดเองสำหรับการแจ้งเตือนต่างๆ
ระดับแนวรับ/แนวต้าน .
สรุป
The indicator features configurable support and resistance zones displayed as semi-transparent rectangles, with adjustable thickness in pips, customizable colors, and opacity. These zones are interactive and can be manually adjusted on the chart, with the indicator tracking any changes.
An alert system notifies users of trend changes, price entries into support/resistance zones, and automatic adjustments of these levels if the auto-support/resistance feature is enabled. Alerts can be customized with different sound files and can be enabled or disabled individually.
The indicator periodically checks for zone adjustments and updates support/resistance levels automatically when trends change, if configured. It supports time frame selection and provides a comprehensive visual and alert-based approach to monitoring price trends and critical levels in trading charts.


