
설명
- 무엇을 하는지 (그 가치).
- 트레이더에게 어떻게 도움이 되는지.
- 무엇이 독특한지.
- 사용 방법 (간단히).
- 유료 버전에서 잠금 해제되는 기능 (예고).
🔸
세션 골든 아워 인디케이터
(무료 버전)
설명
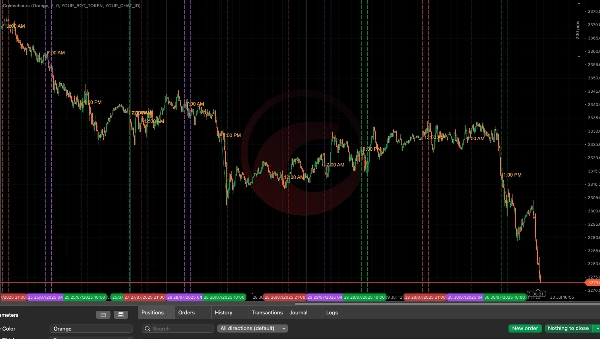
세션 골든 아워 인디케이터는 세션 기반 유동성 패턴을 바탕으로 고확률 거래 창을 시각화하려는 진지한 트레이더를 위해 설계되었습니다. 이 도구는 아시아, 런던, 뉴욕 세션 전반에 걸쳐 가격이 범위를 벗어나 기관의 의도를 드러낼 가능성이 가장 높은 시장의 '골든 아워'라고 불리는 주요 시간대를 자동으로 강조 표시합니다.
기능:
- 아시아 세션 고점/저점 추적 (00:00–08:00 UTC)하여 유동성 구역을 매핑합니다.
- 런던 및 뉴욕 주요 시간 강조 예를 들어:
-
- 런던 프리 클로즈 (06:00–07:00 UTC)
- 런던 클로즈 아워 (07:00–08:00 UTC)
- 뉴욕 오후 스윕 존 (13:00–14:00 UTC)
- 차트에 시각적 가이드 표시 하여 일일 돌파 시간에 대한 인식을 고정합니다.
이점:
- 세션 중복 시 유동성 스윕 존을 쉽게 식별할 수 있습니다.
- 거래 결정을 스마트 머니 시간대에 집중할 수 있어 무의미한 구역에서 거래하지 않습니다.
- 가짜 돌파 및 반전이 발생하는 위치를 시각적으로 인식할 수 있습니다.
- 글로벌 세션 주기를 따르는 모든 상품과 모든 시간대에서 작동합니다.
주요 특징:
- 조절 가능한 선 색상, 두께 및 시간 확장.
- 수동 플로팅 없이 자동 세션 추적.
- 최근 15 거래일 지원 내장.
- 깔끔하고 방해되지 않는 차트 시각화.
추천 대상:
- ICT 스타일 트레이더 (유동성 + 타이밍 모델)
- 가격 행동 스캘퍼
- 시간 기반 컨플루언스를 사용하는 트레이더
🔓 더 원하시나요?
프로 버전 (곧 출시 예정)에는 다음 기능이 추가됩니다:
- 실시간 돌파 알림 를 직접 텔레그램으로 전송
- 아시아 가짜 돌파 → 런던 반전 논리 및 런던 고점/저점 → 뉴욕 반전
- 과도한 알림을 방지하는 스마트 쿨다운 타이머
- 신호 라벨링과 함께 세션 기반 고점/저점 완전 추적
- 향후 로드맵: FVG 알림, 내부 유동성 구역, 신호 필터링
요약
지표 프로필
고객 리뷰
4.0
리뷰: 1
5 | 0 % | |
4 | 100 % | |
3 | 0 % | |
2 | 0 % | |
1 | 0 % |
상담
자주 묻는 질문(FAQ)
트레이딩 봇, 지표, 플러그인 등 cTrader Store에서 제공되는 상품은 제3자 개발자에 의해 제공되며, 이는 단순히 정보 및 기술적 접근을 목적으로 제공된 것입니다. cTrader Store는 중개인이 아니며, 투자 조언, 개인별 추천 또는 향후 성과에 대한 어떠한 보장도 제공하지 않습니다.


가격
3
무료 설치