
Descrizione
Momentum Reversion Model (MRM) è un indicatore tecnico che visualizza potenziali zone di inversione del momentum nell’azione del prezzo.
Analizza la struttura interna del movimento di mercato per evidenziare aree in cui la pressione di vendita potrebbe iniziare a diminuire e potrebbe emergere un momentum di recupero.
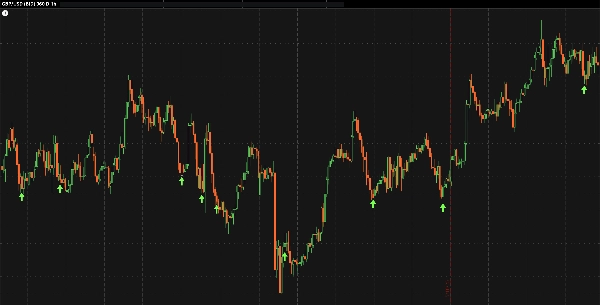
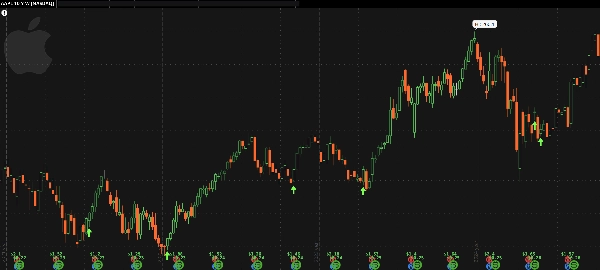
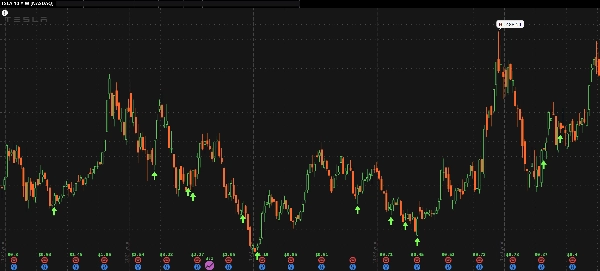
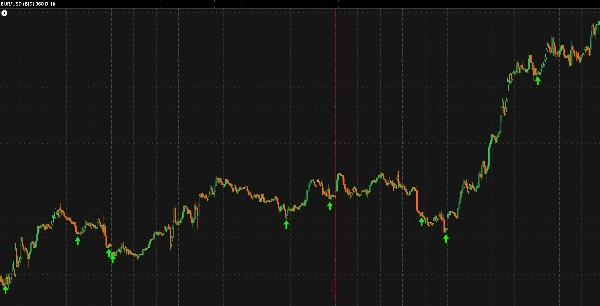
Quando le condizioni del suo modello interno si allineano, MRM traccia una freccia verde sotto la barra del prezzo — segnando un possibile punto di inversione.
Sebbene progettato principalmente per i mercati forex su grafici a 1 ora, può essere applicato anche a dati azionari settimanali per osservare comportamenti analitici simili su diversi timeframe.
Questo indicatore non apre né gestisce operazioni. Fornisce un livello visivo di conferma che può integrare strategie tecniche esistenti o setup discrezionali.
Caratteristiche principali:
- Evidenzia potenziali punti di esaurimento e recupero del momentum
- Si adatta internamente a diversi ambienti di volatilità
- Parametri minimi per un comportamento analitico coerente
💬 Il tuo feedback è importante:
Se trovi utile questo strumento, considera di lasciare una breve recensione nello Store.
Se desideri vedere cBot basati su MRM pubblicati in futuro, sentiti libero di menzionarlo nel tuo feedback — l’interesse della community aiuta direttamente a guidare le future release.
Disclaimer:
Momentum Reversion Model è fornito gratuitamente solo per scopi analitici ed educativi.
Non costituisce consulenza finanziaria, guida al trading o raccomandazione di acquisto o vendita di alcuno strumento.
Non viene fornita alcuna garanzia riguardo accuratezza, performance o risultati.
Tutte le decisioni di trading rimangono interamente a rischio dell’utente, e non si accetta alcuna responsabilità per perdite o danni derivanti dal suo utilizzo.


