
WAVETREND_withSourceCode
Indicatore
Versione 1.0, Oct 2025
Windows, Mac
5.0
Recensioni: 2
Descrizione
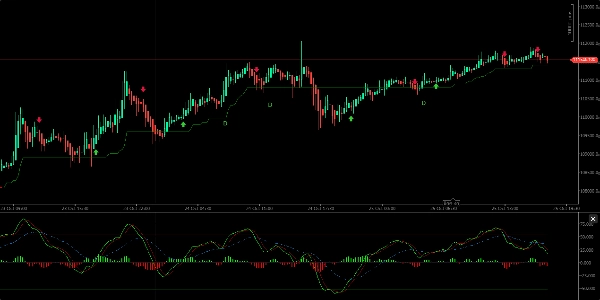
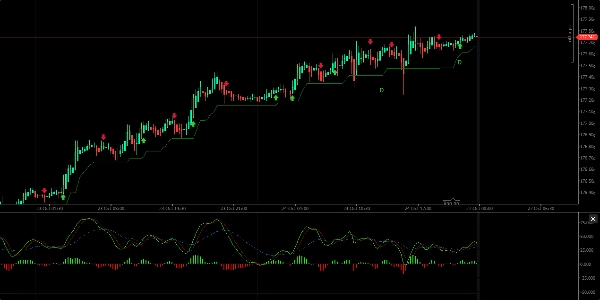
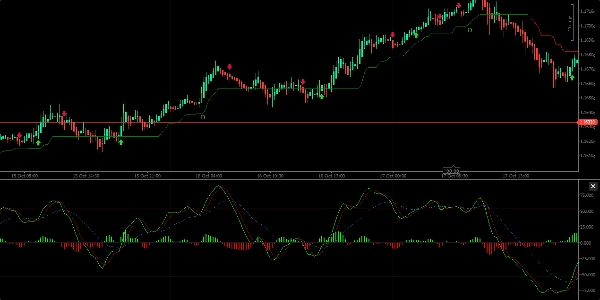
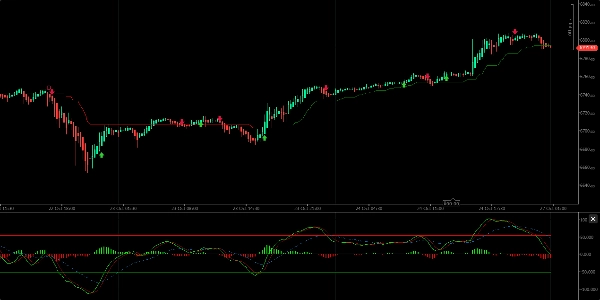
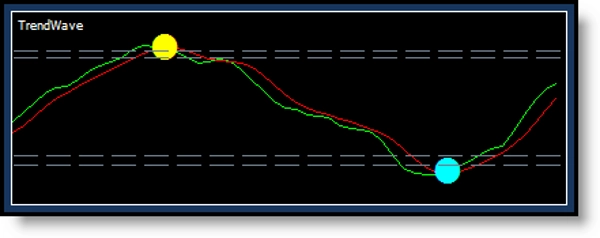
Fornisce segnali di acquisto-vendita, indicazione della direzione del trend e identifica le zone di ipercomprato e ipervenduto. Visivamente, è composto da due linee di valore con una nuvola/istogramma al centro, che si muove sopra e sotto una linea mediana, rappresentando trend in salita o in discesa.
Caratteristiche principali:
- I segnali di acquisto si verificano quando la linea verde attraversa verso l'alto la linea rossa; i segnali di vendita quando la linea verde attraversa verso il basso.
- Mostra la direzione del trend con onde di nuvola sopra o sotto la linea mediana.
- L'indicatore mostra punti verdi (acquisto) e rossi (vendita) sui punti di incrocio, con corrispondenti cambi di colore delle candele (giallo per acquisto, turchese per vendita).
- È meglio utilizzarlo su intervalli di 12 ore o 1 giorno per evitare rumore eccessivo a breve termine.
- L'indicatore può identificare divergenze tra prezzo e momentum (divergenze rialziste e ribassiste regolari), segnalando potenziali inversioni di prezzo.
- Si consiglia di combinare WaveTrend con altri indicatori come WMA, CMF, RSI e MACD per decisioni di trading più affidabili.
In generale, WaveTrend è uno strumento funzionale utile per identificare la direzione del trend e i segnali di trading, ma dovrebbe essere utilizzato insieme ad altri strumenti di analisi per conferma.
Riepilogo
Profilo indicatore
Recensioni dei clienti
5.0
Recensioni: 2
5 | 100 % | |
4 | 0 % | |
3 | 0 % | |
2 | 0 % | |
1 | 0 % |
Recensioni dei clienti
November 6, 2025
the main upside is the trade idea gets slowed down first. The setup still needs say no.
Discussioni
Domande frequenti
Signal
ZigZag
EURUSD
Supertrend
GBPUSD
RSI
XAUUSD
NAS100
ATR
MACD
I prodotti disponibili tramite cTrader Store, inclusi bot di trading, indicatori e plugin, sono forniti da sviluppatori terzi e resi disponibili esclusivamente a scopo informativo e di accesso tecnico. cTrader Store non è un broker e non fornisce consulenze in materia di investimento, raccomandazioni individualizzate o garanzie di risultati futuri.


Prezzo
Da 16/03/2025
256
Installazioni gratuite